

dLocal has reported its earnings for Q2 2026, in which it saw several metrics grow to record levels. We caught up with CEO Pedro Arnt to learn more about the key drivers behind the quarter’s success, serving new verticals, how the company is utilising stablecoins and dLocal’s future plans.

Uruguay-based payment processor dLocal reported strong numbers across the business in Q2 2026, setting new record quarterly revenue, gross profit and total payment volume (TPV) numbers. TPV growth drove a 56% YoY increase in revenue to $400m, which is also a quarterly record for dLocal.
dLocal’s strong performance follows significant investment in its own platform and global expansion, as it continues to capture opportunities in emerging markets. The company now serves more than 60 of these markets and serves over 760 global merchants.
We caught up with dLocal CEO Pedro Arnt to find out more about the payment processor’s Q2 2026 performance and its strategic plans going forward.
What drove record growth for dLocal in Q2 2026?
Daniel Webber:
Pedro, a pleasure to be with you here today. A really tremendous set of results – dLocal keeps growing and reports record revenue, profits and payment volumes. Talk us through the underlying drivers of this growth to begin with.
Pedro Arnt:
Yeah, the business has been firing on all cylinders. TPV growth was 92% YoY so we’ve almost doubled our TPV. Our quarterly TPV was more than the entire year in 2023. So really strong merchant traction, share of wallet gains and market share gains.
I think it’s driven by a macro factor that increasingly merchants are focusing more on the Global South and understanding that the localisation of payments offers better performance and better cost on cards, but more important is to be able to offer the way emerging market consumers want to pay. So local digital wallets, local real-time networks, local debit cards and local card schemes really improve your go-to-market performance.
On the macro side, I think the adoption curve of localised payments is beginning to enter a steeper phase, so we’re seeing our market growing at a very fast pace. If you combine that with what has been very good execution on conversion rates, price, performance and the service model, we’re seeing our merchants increasingly confident in shifting more and more share of wallet to us.
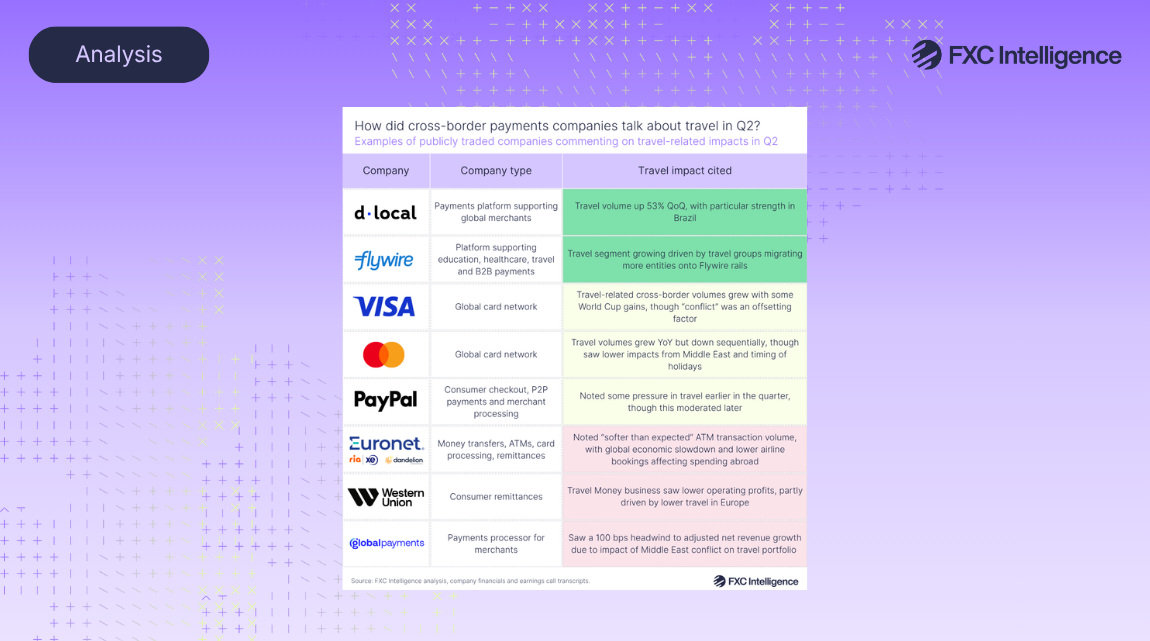
So these stellar results were very much driven, for example, by phenomenal success within the ride-hailing space, very much pushed by one large global ride hailing company really growing their business with us. One of the world’s largest OTAs [online travel agents] is beginning to increase the amount of payments and financial infrastructure they use with us. And so that kind of very high net revenue retention and big, big growth within very large select merchants is what has driven this phenomenal success.
Volume growth drives record revenues and profits for dLocal
dLocal reported a record $400m in revenue in Q2 2026, up 56% YoY, largely driven by a 92% rise in the company’s TPV to $17.7bn – marking the seventh consecutive quarter that the company’s TPV has grown by more than 50% YoY.
It also saw gross profit climb 29% YoY to $127m, while its operating profit increased 15% to $64m – resulting in an operating profit margin of 16%. Overall, operating profit represented 50% of gross profit – around 6% higher than Q1 and 6% below Q2 the previous year.
Chart data
| Quarter | Revenue | Operating profit margin |
|---|---|---|
| Q1 22 | $87m | 33.3% |
| Q2 22 | $101m | 34.7% |
| Q3 22 | $112m | 33.3% |
| Q4 22 | $118m | 22.4% |
| Q1 23 | $137m | 28.7% |
| Q2 23 | $161m | 29.6% |
| Q3 23 | $164m | 31.4% |
| Q4 23 | $188m | 21.8% |
| Q1 24 | $184m | 14.6% |
| Q2 24 | $171m | 17.6% |
| Q3 24 | $186m | 22.1% |
| Q4 24 | $205m | 20.7% |
| Q1 25 | $217m | 21.1% |
| Q2 25 | $257m | 21.7% |
| Q3 25 | $283m | 19.7% |
| Q4 25 | $338m | 18.6% |
| Q1 26 | $336m | 15.7% |
| Q2 26 | $400m | 16.1% |
dLocal also reported growth across all of its geographies, with its core LatAm segment growing 61% YoY overall to $327m (growing its share of overall revenue to 82%). This was largely driven by Brazil and Argentina, which saw 92% and 118% YoY growth respectively. Brazil revenue reached $90m in Q2, accounting for 28% of LatAm revenue, with Argentina revenue hitting $69m, giving it a 21% share of LatAm revenue.
CFO Guillermo Perez also explained that these two countries were the “primary drivers” behind dLocal’s increase in gross profit, with this figure reaching a record $40m in Brazil, while Argentina saw record gross profit of $20m – with both driven by growth in the company’s ecommerce and ride-hailing verticals.
Looking to the future, dLocal says that it plans to focus on realising significant growth opportunities in Asia-Pacific, with the company having already begun to expand its presence in the region. dLocal currently reports Africa and Asia revenue together, with these regions seeing 36% YoY growth in revenue to $73m, which represents an 18% share of overall revenue.
dLocal also reported growth across all of its geographies, with its core LatAm segment growing 61% YoY overall to $327m (growing its share of overall revenue to 82%). This was largely driven by Brazil and Argentina, which saw 92% and 118% YoY growth respectively. Brazil revenue reached $90m in Q2, accounting for 28% of LatAm revenue, with Argentina revenue hitting $69m, giving it a 21% share of LatAm revenue.
CFO Guillermo Perez also explained that these two countries were the “primary drivers” behind dLocal’s increase in gross profit, with this figure reaching a record $40m in Brazil, while Argentina saw record gross profit of $20m – with both driven by growth in the company’s ecommerce and ride-hailing verticals.
Looking to the future, dLocal says that it plans to focus on realising significant growth opportunities in Asia-Pacific, with the company having already begun to expand its presence in the region. dLocal currently reports Africa and Asia revenue together, with these regions seeing 36% YoY growth in revenue to $73m, which represents an 18% share of overall revenue.
Chart data
| Quarter | Brazil | Argentina | Other LatAm | Mexico | Africa & Asia |
|---|---|---|---|---|---|
| Q1 24 | $43.1m | $13.8m | $34.5m | $34.0m | $59.0m |
| Q2 24 | $42.3m | $20.5m | $40.1m | $35.8m | $32.6m |
| Q3 24 | $32.9m | $26.0m | $47.3m | $38.9m | $40.6m |
| Q4 24 | $33.7m | $25.1m | $53.6m | $40.5m | $51.6m |
| Q1 25 | $34.4m | $28.2m | $63.5m | $36.7m | $53.9m |
| Q2 25 | $47.0m | $31.6m | $78.4m | $45.7m | $53.7m |
| Q3 25 | $58.9m | $41.4m | $88.0m | $45.9m | $48.2m |
| Q4 25 | $66.9m | $59.8m | $92.9m | $54.7m | $63.6m |
| Q1 26 | $57.8m | $61.2m | $87.8m | $55.7m | $73.4m |
| Q2 26 | $90.2m | $68.9m | $92.8m | $74.7m | $73.0m |
| Q2 2026 YoY revenue growth | 92% | 118% | 18% | 63% | 36% |
Following the strong quarter with broad-based growth across the company, dLocal opted to raise its guidance for 2026. It now expects TPV to grow 60-70% YoY (up from 50-60%) equating to an annual TPV between $65bn and $69bn. The company also increased its expectations for gross profit for the year to a 25-30% YoY increase (up from 22.5-27.5%).
Why is dLocal’s domestic volumes outpacing cross-border?
Daniel Webber:
Your local-to-local TPV has also grown even faster than the cross-border. What is happening there?
Pedro Arnt:
So actually, there’s a very strong vertical determination to that. So for example, ride hailing, which I’ve said is one of the very fast growing verticals, or food delivery. Both of those are typically marketplace businesses where the company collects a significant amount of cash through us, but then disburses either to the driver or the food deliverer.
So there is a clear vertical alignment between companies that are more inclined to want international settlement, so cross-border, and companies that need local settlement because then there’s a disbursement leg to their business. So in this particular case, the rapid acceleration of the local-to-local business is intrinsically tied to how well the ride-hailing and food delivery verticals have been performing, which tend to be local-to-local.
Cross-border share of TPV drops as domestic volumes surge
dLocal’s cross-border volume continued to see strong growth in Q2 2026, increasing 46% to $6.9bn. This accounted for a 39% share of TPV, although this is down from 51% in Q2 2025.
Chart data
| Quarter | Cross-border volume | Local-to-local volume | Cross-border volume share |
|---|---|---|---|
| Q1 22 | $1.3bn | $0.8bn | 61.9% |
| Q2 22 | $1.5bn | $0.9bn | 61.1% |
| Q3 22 | $1.5bn | $1.2bn | 56.5% |
| Q4 22 | $1.7bn | $1.6bn | 52.9% |
| Q1 23 | $2.0bn | $1.6bn | 54.8% |
| Q2 23 | $2.2bn | $2.2bn | 50.7% |
| Q3 23 | $2.3bn | $2.4bn | 48.9% |
| Q4 23 | $2.2bn | $2.9bn | 43.7% |
| Q1 24 | $2.4bn | $2.9bn | 45.7% |
| Q2 24 | $2.7bn | $3.3bn | 44.8% |
| Q3 24 | $3.0bn | $3.5bn | 46.6% |
| Q4 24 | $3.7bn | $4.0bn | 48.5% |
| Q1 25 | $4.3bn | $3.8bn | 52.5% |
| Q2 25 | $4.7bn | $4.5bn | 51.2% |
| Q3 25 | $5.3bn | $5.1bn | 51.2% |
| Q4 25 | $6.0bn | $7.1bn | 45.6% |
| Q1 26 | $6.3bn | $7.7bn | 45.1% |
| Q2 26 | $6.9bn | $10.8bn | 38.9% |
| Q2 2026 YoY revenue growth | 92% | 118% | 18% |
While the company’s cross-border volume growth has slowed compared to 2025, the key driver behind cross-border’s declining share of TPV is the rapid growth of domestic (known as local-to-local in dLocal’s earnings) volume, which has increased by 141% YoY to $10.8bn. This signals the fifth quarter in a row that dLocal has seen local-to-local volumes increase QoQ, with Perez explaining that this was driven by ride-hailing and on-demand delivery, which are businesses that primarily require local-to-local services.
Chart data
| Quarter | Cross-border volume | Total payment volume | Local-to-local volume |
|---|---|---|---|
| Q2 24 | 21.7% | 38.0% | 54.8% |
| Q3 24 | 34.5% | 41.1% | 47.3% |
| Q4 24 | 67.3% | 50.9% | 38.2% |
| Q1 25 | 75.5% | 52.7% | 33.5% |
| Q2 25 | 74.7% | 52.6% | 34.8% |
| Q3 25 | 75.2% | 59.5% | 45.8% |
| Q4 25 | 59.7% | 69.9% | 79.5% |
| Q1 26 | 48.7% | 73.4% | 100.6% |
| Q2 26 | 45.8% | 92.1% | 140.7% |
dLocal sees expansion into developing nations bolster remittance growth
Daniel Webber:
Let’s talk about the remittance segment, which is also performing well. You now serve seven of the ten largest remittance companies and the segment saw 69% YoY growth – which is much faster growth than the underlying remittance market. What is enabling you to really pick up share there?
Pedro Arnt:
Yeah and 18% QoQ growth, so very strong there. I think first of all, our footprint. We now cover 60 emerging markets. A lot of what we’ve been doing is pushing into more frontier markets, offering both collections and remittance infrastructure, but obviously those are markets that, because of the nature of those economies, are very reliant on remittance flows. So many of the new markets we’re adding are markets that have strong remittance businesses. So some of the growth is through incremental footprint.
Some of the growth is simply that as we grow our relationships with the remittance partners, they trust us more and more. Also I think, to a smaller level but this is relevant, we offer stablecoin capabilities for settlement and delivery there.
Roughly 40% of our remittance flows are already showing at least one leg of stablecoin, either how the remittance partner sends the funds to us or how we ultimately settle. That significantly speeds up the pace of the transaction, which in remittances is critical. I think having that digital asset capability is also part of the strong growth we’re seeing there.
Local-to-local businesses emerge as key growth drivers in Q2
Ride-hailing and on-demand delivery drove a significant part of the 92% YoY growth in dLocal’s TPV in Q2 2026, seeing 248% and 204% YoY growth respectively – both of which inherently carry a higher local-to-local component than most other verticals. dLocal says that it now serves four of the largest ride-hailing companies operating in emerging markets.
Ecommerce once again remained the company’s largest vertical, rising 59% YoY to around $5bn, while remittances saw slightly faster 69% growth YoY, contributing around $600m to dLocal’s TPV for the quarter. The payment processor says that it now also serves seven of the ten largest remittance companies.
Overall, the company reported strong growth across all of the verticals it currently serves. This supports dLocal’s wider strategy to diversify revenue across a larger number of verticals and reduce reliance on a small number of them.
Chart data
| Quarter | Ecommerce | Ride-hailing | On-demand delivery | Financial services | SaaS | Advertising | Streaming | Remittances | Travel | Other |
|---|---|---|---|---|---|---|---|---|---|---|
| Q2 25 | $3.2bn | $1.0bn | $0.8bn | $1.0bn | $0.9bn | $0.8bn | $0.8bn | $0.4bn | $0.2bn | $0.2bn |
| Q2 26 | $5.1bn | $3.3bn | $2.6bn | $1.5bn | $1.4bn | $1.3bn | $1.2bn | $0.6bn | $0.5bn | $0.3bn |
| Q2 26 YoY revenue growth | 49% | 248% | 204% | 52% | 66% | 74% | 42% | 69% | 156% | 37% |
How is dLocal serving digital asset exchanges and AI companies?
Daniel Webber:
You’re also beginning to serve some of the world’s pre-eminent AI companies and digital asset exchanges now. What are the types of services that are resonating with those groups?
Pedro Arnt:
To be clear, I think we’re further along on the digital asset exchanges and digital asset players. On AI companies, I think there are at least some very positive initial wins, which allow us to get involved and start learning about their specific pain points.
On digital assets, I think there’s two of our products that are the ones that are being used the most. Obviously the on-ramps and off-ramps; because we have built collections capability and payout capabilities, and we have significant local liquidity because of our existing businesses, we’re an ideal partner for on-ramping and off-ramping for these exchanges.
The other product that’s also beginning to gain some traction is, as the world increasingly moves to specific regulations for digital assets, requiring more VASP licences for example, our ability to hold those licences or to build financial infrastructure that is compliant with what those licences require is also beginning to be a big reason for traction in those segments.
For example, the Brazilian VASP licence places significant requirements on how you segregate funds, how you open accounts on a per individual user basis, and all of that infrastructure is infrastructure that we’re able to offer and that many of the digital asset providers who are pursuing licences in Brazil or in other markets now need. So that piece of the infrastructure is also one of the reasons that business in that vertical is growing for us.
dLocal leverages long-standing position to drive future growth
Daniel Webber:
We increasingly see how the industry really is valuing both the collection side and the payout side. dLocal has been doing this for a long time, how does your long-standing position benefit you?
Pedro Arnt:
I think what it means is first of all we have more piping that we’ve laid out. By that, I mean the number of collection payment methods and alternative payment methods, the number of banks and other forms of delivering the endpoint for a payout across many markets than many others.
We’ve been building that infrastructure for over 10 years and we continue to build it. I think in terms of licensing and regulatory, both understanding and presence, having been in those markets for longer means that we have a longer track record with the regulator. Whenever you’re doing things like netting or you’re moving currency in emerging markets, that’s always an area that comes under significant central bank oversight.
So having a track record in the market, both with regulators but also with banks and partners, I think helps in these markets where currency is always very closely guarded. Finally, it’s just the local know-how and the understanding of how each market operates and how to get the best performance on behalf of our merchants in each market, which is very specific and changes significantly from market to market.
Daniel Webber:
Pedro, is there anything else you’d want us to share more broadly or about this set of results before we close?
Pedro Arnt:
We’re entering the second half of the year with some incredibly strong momentum and I think that bodes very well for us, not only for the second half of this year, but more importantly longer term.
Daniel Webber:
Fantastic. Pedro, thank you so much.
Pedro Arnt:
Thank you, as always. Good to see you.