

In the year following the passing of the GENIUS Act, stablecoins have become a major topic in cross-border payments. But is adoption following? In an industry first, FXC Intelligence and Allium collaborate to identify the true share of the cross-border payments market being moved using stablecoins.
Over the past year, stablecoins have become one of the most-discussed topics in cross-border payments. With the GENIUS Act having passed in July 2025, companies from across the cross-border payments space have rushed to explore the technology, with many launching new stablecoin-focused products or announcing that they have switched some elements of their operations to stablecoins moving on blockchain-based rails.
However, it is not always clear how much of the world’s cross-border payments market is currently being moved using stablecoins. While transaction volume data is often used to highlight growth in the sector, the majority of this raw volume is non-economic activity, with the remaining portion combining both domestic and cross-border payments, leaving the industry relying on at best very rough estimates to gauge the size of the space.
This report is designed to change that. For the first time, it brings together two leaders in data, on-chain data provider Allium and cross-border payments data provider FXC Intelligence, to provide an unparalleled picture of the current size and split of cross-border payments volume using stablecoins.
While stablecoins remain a small share of the market, our combined data shows just how rapidly the space is growing, and which parts of the industry are seeing the highest rates of adoption.
Methodology: Aligning FXC Intelligence and Allium’s datasets
This report combines Allium on-chain data and FXC Intelligence market sizing data to provide robust directional estimates for the size of the stablecoin and non-stablecoin retail cross-border payments market, sometimes referred to as the non-wholesale market. This covers payments involving either businesses or consumers made between two countries, but excludes wholesale payments between financial institutions.
Focusing on the most recent full year, 2025, with additional data for 2024 to provide context and growth rates, the collaboration has seen both companies work closely together to align their disparate datasets and provide a robust view of the current state of stablecoin adoption in cross-border payments.
For Allium, this saw the company draw from its Real-World Payments layer, which covers around 2.1 billion transactions between 2024 and 2026 YTD, with non-payment transactions, including internal settlement, treasury mint and burn and exchange rebalancing classified out. The company also filters out deposits into institutional and exchange wallets, and excludes any intermediary hops within a payment, using immediate counterparty attribution.
While its dataset includes all payments, Allium used geotagged data across the Ethereum, Polygon, Base, Solana and Tron blockchains to identify cross-border payments specifically for review against FXC Intelligence’s datasets. Allium’s resulting cross-border stablecoin volume figures are based on scaled estimates from this data.
FXC, meanwhile, aligned Allium’s data to its proprietary market sizing dataset, which provides detailed estimates of the size of the cross-border payments market down to a corridor level based on a broad range of public and private data sources and analysis.
This sees the data in this report in many cases broken down into the following use cases for both stablecoin and non-stablecoin (fiat) flows:
- Consumer-to-consumer (C2C) – payments sent from one individual to another, including remittances and high value person-to-person (P2P) payments
- Business-to-business (B2B) – payments sent from one business to another, typically to cover the cost of goods or services
- Business-to-consumer (B2C) – payments sent from a business to a consumer, such as a payout on an insurance policy
- Consumer-to-business (C2B) – payments sent from a consumer to a business, such as to pay for a service or product
The report sees us combine the total fiat market size – which FXC updated in April following the March publication of our market size report – with the total stablecoin market size, to provide an overall market size from which we calculate market share.
We also provide some geographical analysis, which sees us segment the world into three sections: Asia-Pacific (APAC), Europe, the Middle East and Africa (EMEA) and the Americas.
How much of the cross-border payments market is being moved with stablecoins?
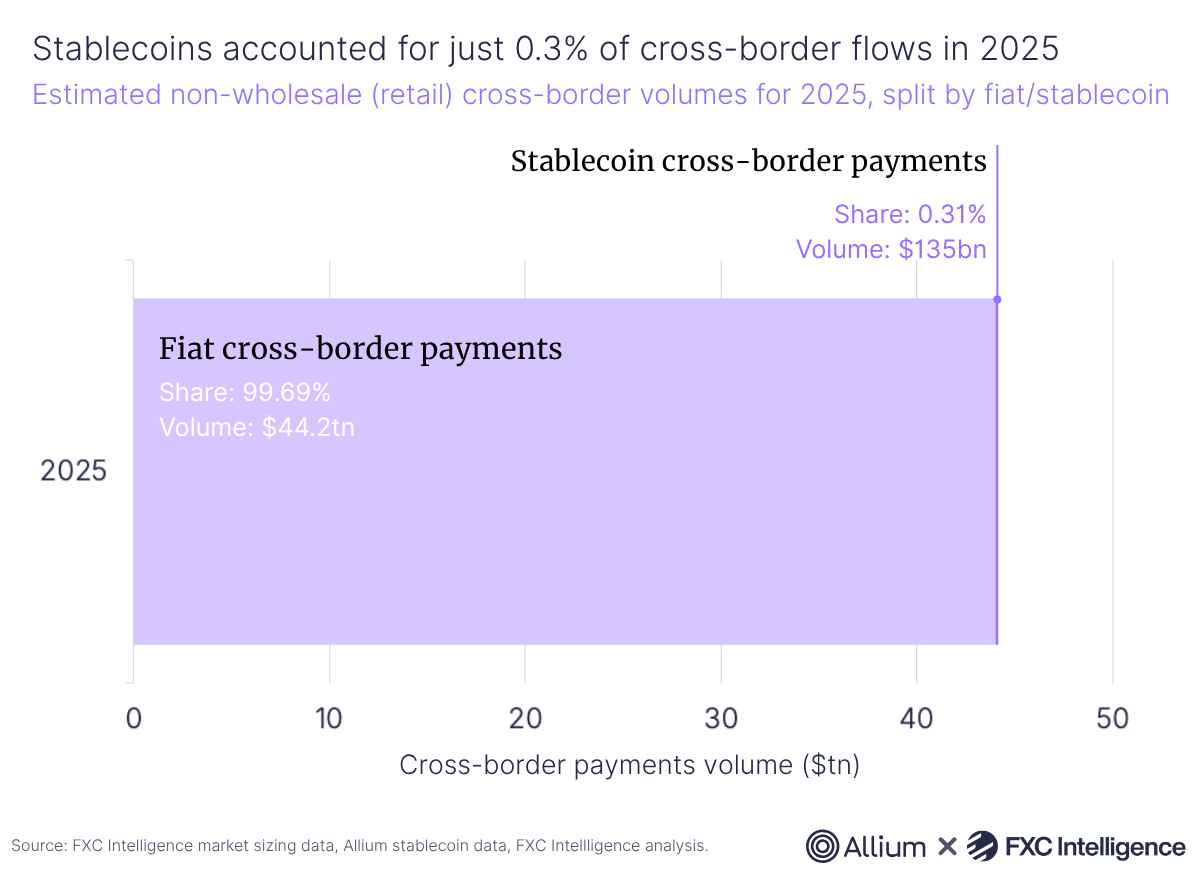
At present, stablecoins remain a very small part of the overall retail, or non-wholesale, cross-border payments market, accounting for an estimated $135bn of the $44.3tn moved globally in 2025. This represents 0.31% of total volume.
That headline figure is a notable uptick on 2024, which saw an estimated $82bn moved using stablecoins. This represented 0.2% of $40.5tn in retail cross-border payments volume.
This reflects the fact that while stablecoins are moving significant monetary volume, this is dwarfed by the size of the overall retail cross-border payments market. However, the overall share also hides significant variation by use case, about which we go into in more detail below.
Stablecoin cross-border payments by use case
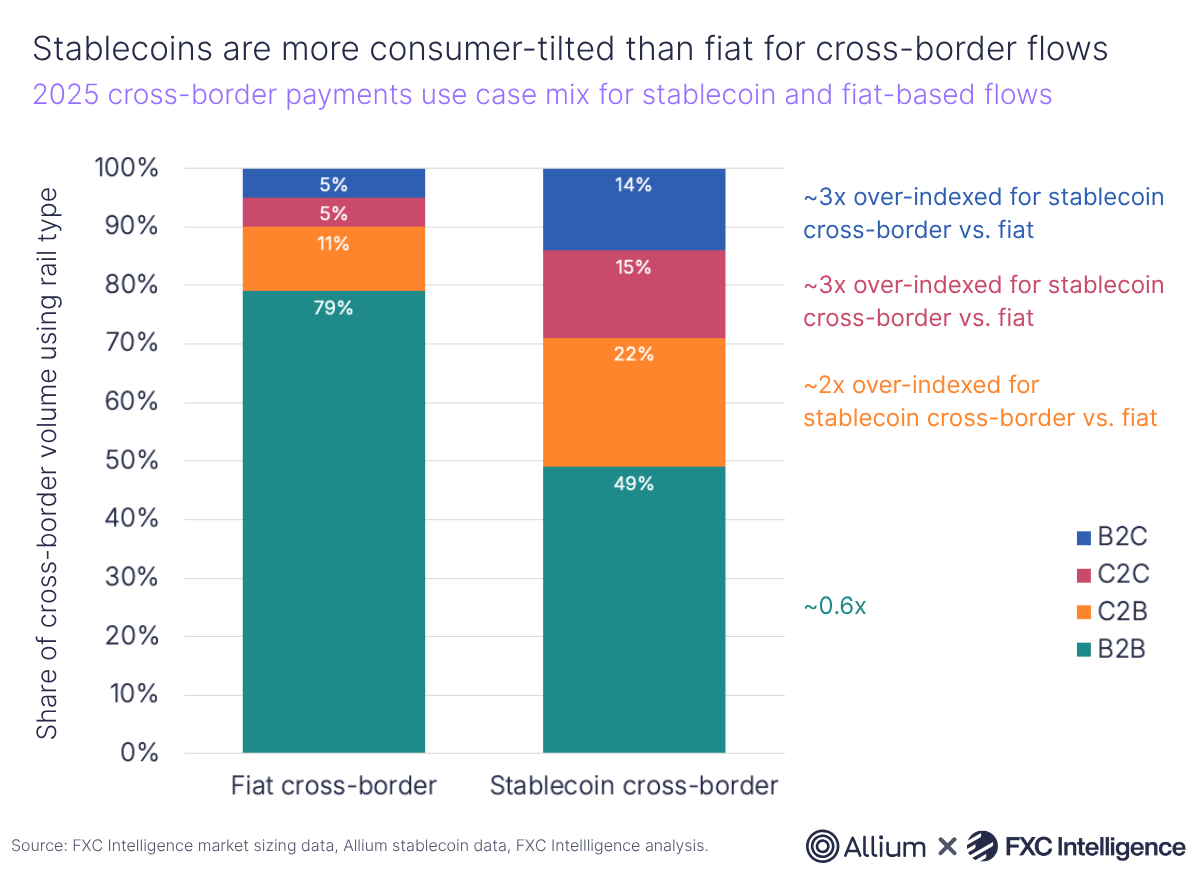
B2B payments is by far the largest segment of overall non-wholesale cross-border payments, and retains this lead for cross-border payments moved using stablecoins. However, there is a very pronounced difference between the two when it comes to use case mix, with transactions involving consumers consistently having a greater rate of adoption than those involving only businesses.
While B2B accounts for 79% of all cross-border payments flows using fiat rails, it accounts for just 49% of money moved using stablecoins, around 0.6x of the share.
By contrast, C2C payments is the area where stablecoins see the most outsized adoption relative to their overall share of the market, accounting for 15% of all stablecoin volume compared to 5% for fiat – an over-index rate of around 3x.
B2C has a similar rate of over-indexing for stablecoins, at 14% of all stablecoin volume versus 5% for fiat, while C2B accounts for 22% of stablecoin volume compared to 11% of fiat volume.
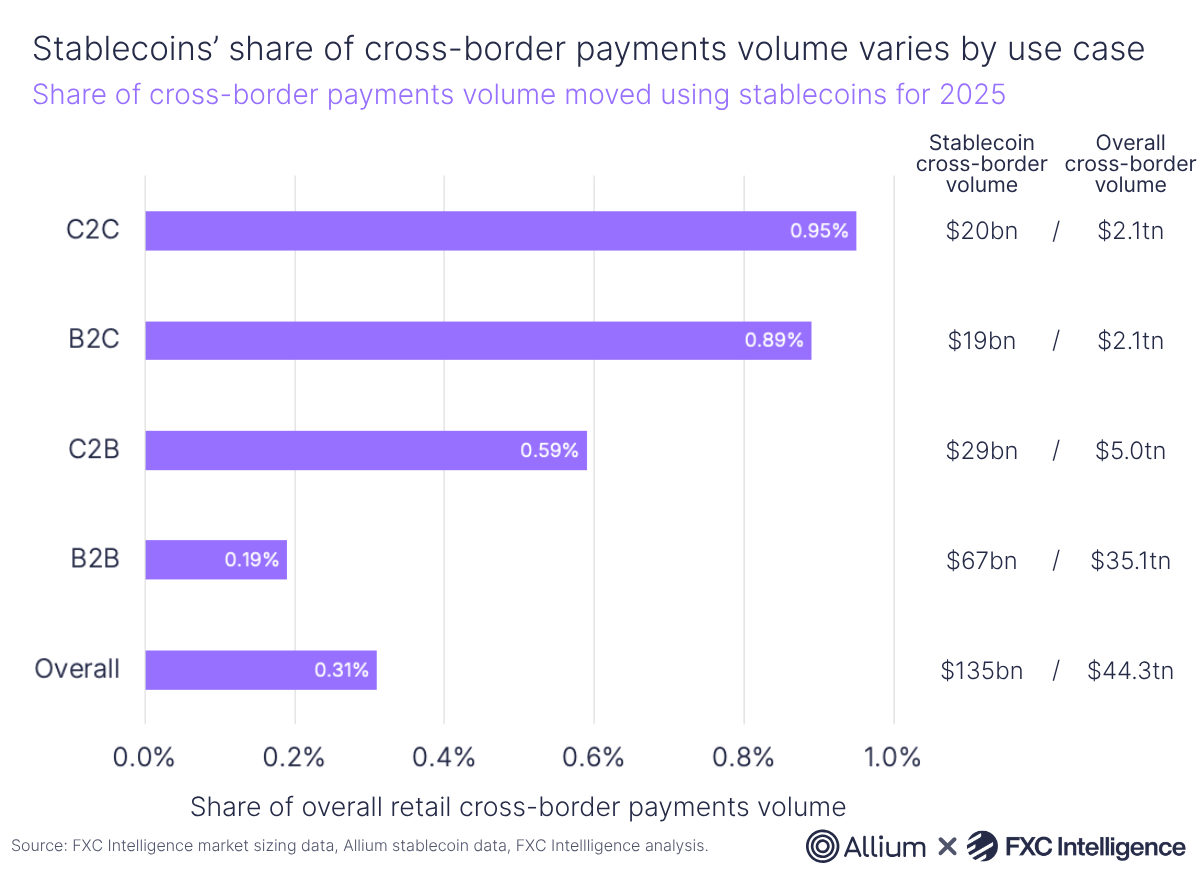
These differences in use case mix mean that some segments have achieved a far higher share of cross-border payments volume than the overall 2025 headline of 0.31%. In the lead is C2C which is the closest to cracking the 1% mark, achieving 0.95% in 2025, compared to 0.7% in 2024.
B2C is also not far behind at 0.89%, compared to 2024’s 0.62%. In both cases, if current rates continue, it is likely that their shares of their respective cross-border payments markets will pass 1% in 2026.
C2B, meanwhile, is at 0.59% in 2025, while B2B is on just 0.19%, with this small share and its vast scale as a market segment together bringing down the top-line share for stablecoin cross-border payments.
It is notable that the segment with the most absolute stablecoin volume (B2B) has the smallest share of its volume moved using stablecoin. Meanwhile, consumer-involved use cases – where issues such as fiat friction, cash-out costs and receive-side FX volatility are felt most strongly – see the highest stablecoin adoption rates.
However, penetration has deepened for all segments between 2024 and 2025, with C2B and B2B rising fastest off a lower base.
The difference in adoption rate between flows involving consumers and those that only involve businesses is likely due to a number of factors. Consumers are more likely to switch between multiple providers than businesses – which will typically select and and maintain a single provider for a period of time – and so can switch the rails they move their money with far greater ease. The increased regulatory, trust and compliance barriers businesses face when it comes to global money movement are also likely to make them more hesitant to adopt stablecoin-based solutions, even if there is a provable monetary upside.
Stablecoins are seeing rapid growth in adoption
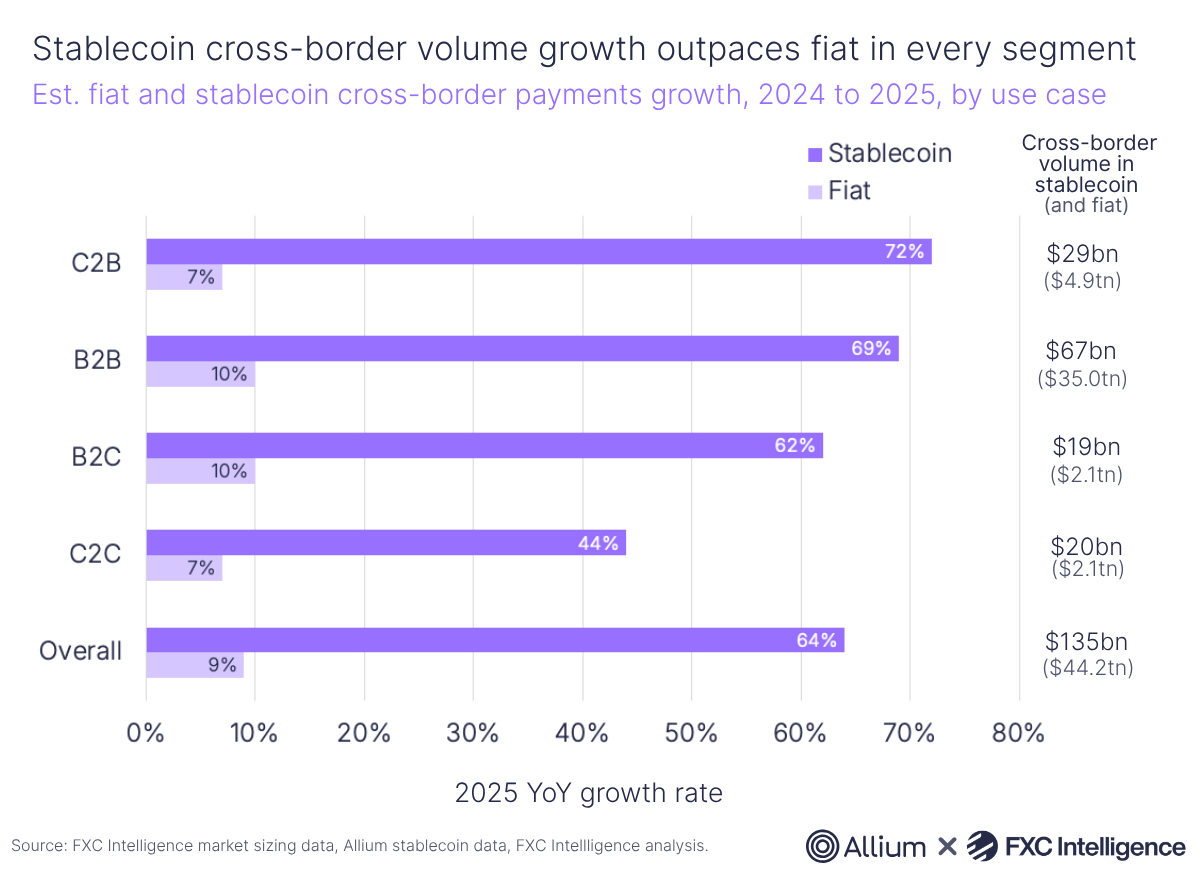
Overall, estimated cross-border payments volume using stablecoins grew by 64% YoY compared to 9% for their fiat counterparts, however while every segment has contributed to this growth not all have grown by the same rate.
C2C, where stablecoin adoption rates are higher, saw 44% growth, compared to C2B’s leading growth rate of 72%. B2B is notable for being second on the list, at 69%, with B2C in third at 62%.
The high growth rate relative to fiat is to be expected given stablecoin’s far lower baseline, and stablecoins’ growth rate is likely to sit above fiat’s for some time. Recent developments in the regulatory landscape, as well as increased focus on the technology as a viable alternative to fiat, are also likely to have helped drive adoption.
Initial data for 2026 year-to-date suggests that this growth rate is slowing, with overall rates currently sitting at around 23% and B2C seeing the fastest growth at 28%, however with some flows being seasonal and the market still evolving, the full-year data may paint a different picture when it becomes available.
What regions are using stablecoins the most?
While there is growth globally, adoption is varied by market, and a small number of markets currently account for an outsized share of the volumes moved by using stablecoins. In 2025, the top three corridors for stablecoin flows – Taiwan to Turkey; Taiwan to Indonesia; and Turkey to Indonesia – accounted for around 13% of all stablecoin cross-border payments.
Alongside these three markets, Mexico, Ukraine and South Korea also rank among the top for outbound cross-border payments using stablecoin, which is notable as these are largely not the leading markets for outbound cross-border payments using fiat.
Markets largely fall into one of two types that explain their increased use of stablecoins for cross-border payments. In the case of Turkey, Ukraine, Mexico and Indonesia, FX, inflation and capital-control stress are likely to be the cause of their increased use of stablecoin rails. Meanwhile for Taiwan and South Korea, their deep crypto-trading ecosystems are likely to have driven a culture of increased adoption, rather than users being driven by price-related factors.
The nature of these flows is likely to be different from their fiat equivalents. On the Mexico to US corridor, for instance, the dominant direction of stablecoin payments runs opposite to that of traditional remittances, which flow overwhelmingly from the US to Mexico. That reversal suggests the on-chain activity is not remittance at all, but demand for dollars, whether to save, hold or settle, from users in a market where access to the currency is otherwise constrained. Alongside the FX, inflation and capital-control pressures, it reinforces the sense that stablecoin cross-border adoption is being driven as much by what users struggle to get through the traditional system as by cost.
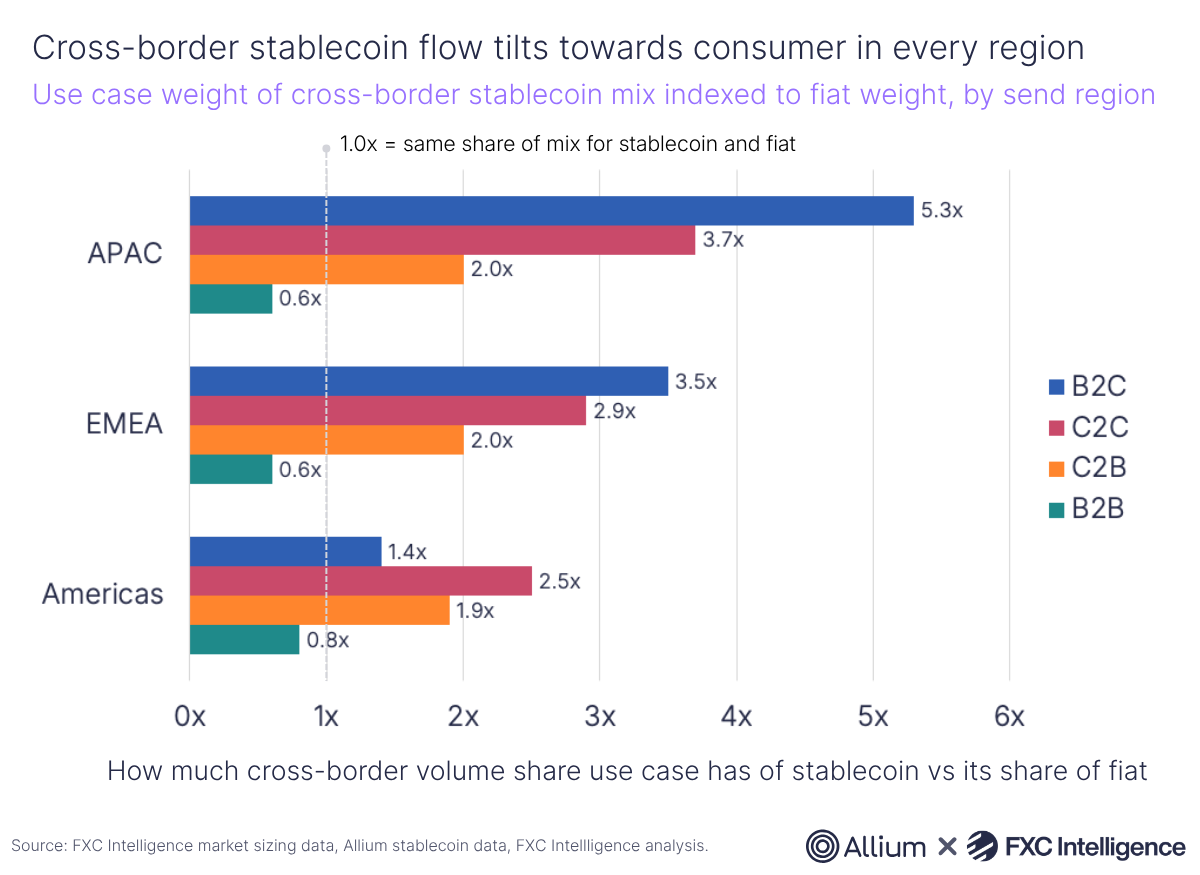
Indexing each region’s stablecoin use-case mix to its fiat mix shows the increased tilt towards consumer-related uses is universal. Stablecoin-based B2C runs at 5.3x its fiat weight in APAC, 3.5x in EMEA and 1.4x in the Americas, while C2C sees stablecoin share outpace fiat share by a range of 2.5x to 3.7x. C2B, meanwhile, is at roughly 2x everywhere.
The story is similar in reverse for B2B, which under-indexes in every region at 0.6x to 0.8x. In level terms, this means it is 46% to 57% of estimated cross-border stablecoin flow per region, versus roughly 76% to 81% of the fiat base. The Americas are notable for being the most B2B-tilted region, while APAC is the most consumer-tilted.
Future developments
Although there are signs of slowing growth in 2026 relative to 2025 for stablecoin cross-border payments volume, stablecoins are set to continue to outpace fiat cross-border payments volume growth in 2026 and potentially beyond. This will result in a greater share of the world’s money being moved on stablecoin rails.
If current rates hold, C2C and B2C look set to pass the 1% penetration mark in 2026, the point at which stablecoins move from a rounding error to a measurable share of those segments. The more telling shift, though, is directional: cross-border payments are beginning to sort by use case and by market, and stablecoins are establishing themselves first where the traditional system serves users least well.
However, it remains to be seen how big the market could ultimately become, and there is a long way to go for stablecoins to be on a level playing field with fiat when it comes to cross-border payments.
We’ll continue to explore the interplay between fiat and stablecoin cross-border payments, as well as their ongoing growth and future trajectory, in future collaborations between FXC Intelligence and Allium. In the meantime, we are available to support your cross-border payments/stablecoin data needs with custom deliveries – reach out to either FXC Intelligence or Allium to find out more.