In December, the World Bank released a report on the cost of making local P2P and P2B payments, underpinned by FXC Intelligence data on domestic payments fees. Below, we’ve explored some of the key implications of this report.
The World Bank’s new six-country pilot on domestic payment pricing, carried out in partnership with FXC Intelligence using our domestic fee data, reveals a simple pattern: where fast payment systems were widely accessible and interoperable, domestic P2P and P2B fees tended to fall sharply across the providers included in the pilot.
However, the study also shows two persistent frictions: merchant acceptance remains notably more expensive online than in-store and incomplete fee and speed disclosure still limits both consumer choice and regulatory oversight.
For lower-cost domestic payments, the evidence from this pilot points to a clear design principle: make fast payment systems broadly accessible and interoperable. On top of this, since payout rails shape the ‘last mile’, the same design choices can materially affect cross-border delivery cost and speed.
To support the World Bank pilot study, we compiled and standardised pricing data representing the cost of accessing and using domestic payment services across leading domestic payment service providers (PSP) in six diverse markets – including Brazil, Colombia, India, Nigeria, Thailand and the UK – in the first six months of 2023. In total, the report uses data from 103 providers across the six countries, with data from 56 providers for P2P payments and 62 for P2B payments.
The World Bank’s six-country pilot shows that fast payment systems (FPS) are the most consistent lever for lowering domestic P2P and P2B costs. Even so, merchant acceptance remains expensive online, and data opacity still blocks effective policy and product design.
In this piece, we’ve taken a closer look at some of the key insights from the data on domestic payments, which also provides significant lessons for cross-border payments. You can view the report in full on the World Bank’s website.
Methodology behind the World Bank domestic payments report
The cost of making P2P and P2B payments varied significantly across the six countries, showing the disparity in making domestic payments globally due to various factors. These include transaction value, speed, provider, account type (bank accounts, mobile money accounts and e-money accounts) and transaction channel (payments made in person at stores or bank branches, or digitally through the internet, mobile phones or call centres).
Given the role of mobile money in driving financial inclusion in Africa and elsewhere, mobile money accounts – i.e. accounts accessed primarily via mobile phone – are analysed separately from all other types of e-money accounts (i.e. accounts that store money electronically).
For P2P payments, the fees charged to consumers for making domestic P2P digital transfers were compiled. This includes both intra-PSP, where both the payer and payee have accounts with the same provider, and inter-PSP transactions, where they have accounts with different providers. For P2B payments, the fees that merchants pay to providers for receiving domestic digital payments were compiled.
The report uses a scaling ratio in addition to exchange rates for the first six months of 2023 in order to determine the equivalent of a $180 P2P transaction and a $70 P2B transaction across the different markets. These standardised transaction sizes are based on US market data, with the P2P transaction size chosen based on the average dollar value per mobile payment app transaction taken from the Federal Reserve Bank of Atlanta’s 2021 Survey and Diary of Consumer Payment Choice. Meanwhile, the P2B transaction was based on the average dollar value for debit and credit card payments obtained from the 2021 Federal Reserve Payments study.
The assumption about transaction sizes has important implications for fees because providers can use tiered pricing depending on payment amount.
Domestic bank-to-bank fees had a large impact on P2P costs
The report compared the costs of sending money to/from a variety of accounts – including bank accounts, mobile money accounts and e-money accounts. The graphic below shows the average cost of sending P2P transfers across these various countries through both inter and intra-PSP channels.
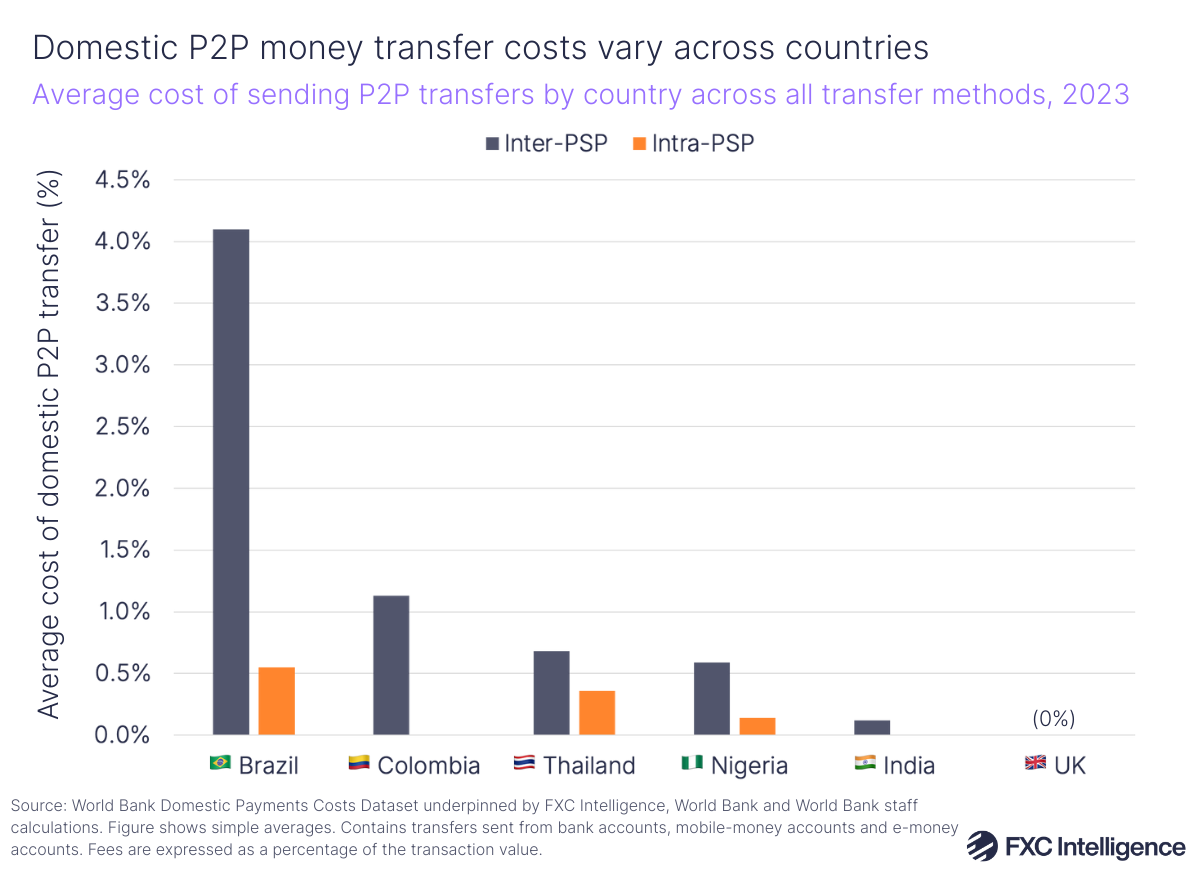
Fees and costs figures are simple averages from provider fee schedules in the pilot sample, benchmarked to standardised transaction sizes.
Across inter-PSP transactions for providers in the study, Brazil had the highest P2P fees overall, with average fees of 4.1% of the transaction value, followed by Colombia at 1.13%. Thailand, India and Nigeria had relatively lower fees, at 0.68%, 0.59% and 0.12% respectively. Unsurprisingly, the report found that inter-PSP transfers are more expensive than intra-PSP transfers across almost all the markets for the providers tracked. In the UK, all P2P transfers are offered free of charge for the account/provider types included in the study.
Brazil and Colombia’s higher inter-PSP fees are skewed significantly by high domestic bank-to-bank transfer fees: these were 5.18% for Brazil and 1.78% for Colombia across the assessed providers (this includes both traditional banks and digital banks, which are run primarily through an app or website). These are being driven by high fees on some legacy rails across providers in these countries.
Brazil, for example, sees significantly higher costs for bank account-to-bank account transfers made through its non-instant legacy payment rails compared to its instant payment system Pix. Its non-instant systems include Transferência Eletrônica Disponível (TED), Brazil’s interbank transfer system for same-day money movement, and Documento de Ordem de Crédito (DOC), the country’s payment method that batch processes smaller transactions with these usually being sent to arrive the next business day. Fees for using these systems on average varied between 5-7% across providers in the study, while Pix sees zero costs for such transfers.
By comparison, countries such as India, Nigeria and Thailand see relatively lower fees across rails that are serving bank-to-bank transfers than in Brazil and Colombia. For India, as an example, this is being driven by the ubiquity of its fast payment, zero-fee rail Unified Payment Interface (UPI) across providers. However, other rails in the country – in particular National Electronic Funds Transfer (NEFT) and Immediate Payment Service (IMPS) – also have lower fees compared to rails in other countries, reducing India’s overall average.
While Brazil and Colombia saw higher costs for inter-PSP transfers between banks in the study, transfers from both countries through digital banks or e-money providers had zero costs. Nigeria and Thailand also noted higher costs for inter-PSP transfers between traditional banks in the study than digital methods. On the other hand, the cost of sending money from India through e-money accounts was higher on average than the cost of traditional bank-to-bank transfers, though transfers through these providers using the UPI rail came at zero cost.
The vast majority of digital banks and e-money providers included in the study saw zero costs for sending intra-PSP transfers, with the exception of Nigeria, which had an average 0.04% cost for transfers through e-money providers. By comparison, intra-PSP transfers through traditional banks in some countries continued to carry costs, including Brazil (0.64%), Thailand (0.48%) and Nigeria (0.17%). Overall, the figures highlight the significance of introducing digital payments, particularly in Latin America where the difference in fees between legacy bank-to-bank transfers and other P2P payment methods is particularly stark.
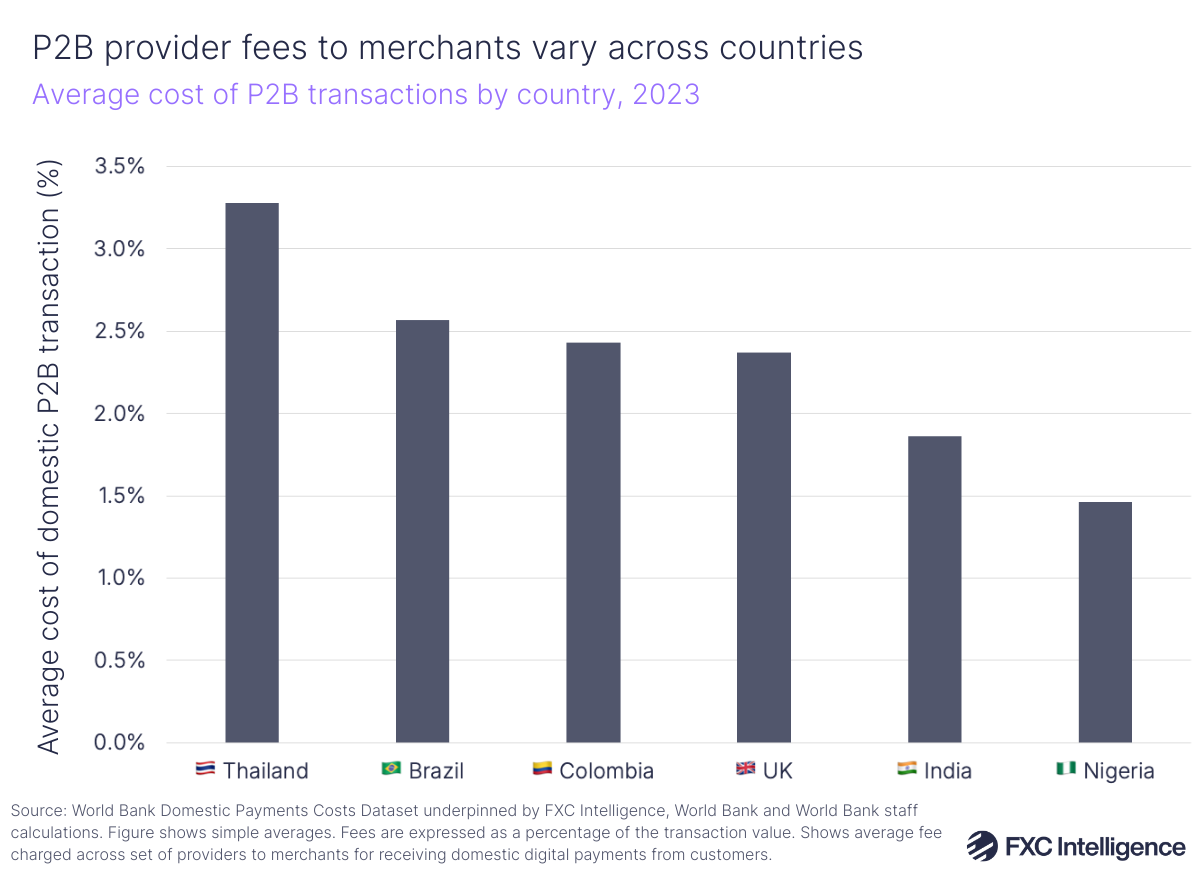
P2B provider costs across the six countries also varied across the included services. On average across all payment methods – including cash vouchers, credit and debit cards, credit transfers and e-wallets – costs ranged from 1.46% in Nigeria to 3.28% in Thailand, with an average of 2.33% across the markets overall.
The report notes significant challenges with collecting data for P2B transactions, which often involve multiple parties charging a fee and can sometimes see costs being bundled into a single charge for merchants. Other factors contributing to these challenges include different payment methods (e.g. premium vs non-premium cards), use of QR code payments and even different point-of-sale (PoS) technology used in processing payments for different regions.
Access data on domestic and cross-border payments pricing globally
In-person bank transfers had much higher costs than digital P2P payments
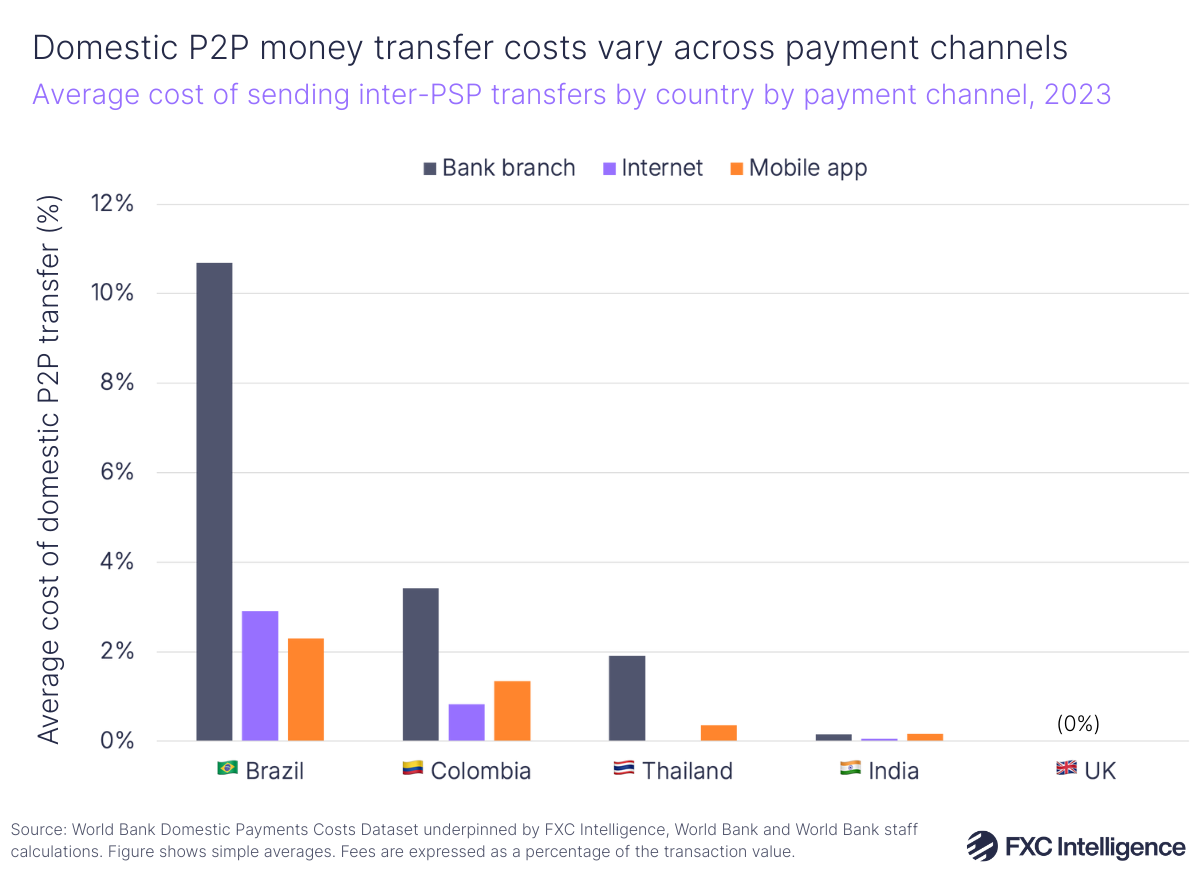
Data from the report showed that inter-P2P transfers between bank accounts tended to be more expensive than from bank accounts to e-money accounts. In addition, looking at specific channels highlighted that in-person transfers carried out at banks tend to be more expensive than digital transfers across the providers included.
Again, this disparity is largest in Brazil, where inter-P2P transfers made via bank branches had fees of 10.69% in 2023, versus 2.91% for transfers made online and 2.3% for those made via a mobile app.
Meanwhile, digital P2B transactions made online via links or gateways were more expensive than in-person PoS transactions, showing the higher costs merchants face to facilitate online payment acceptance.
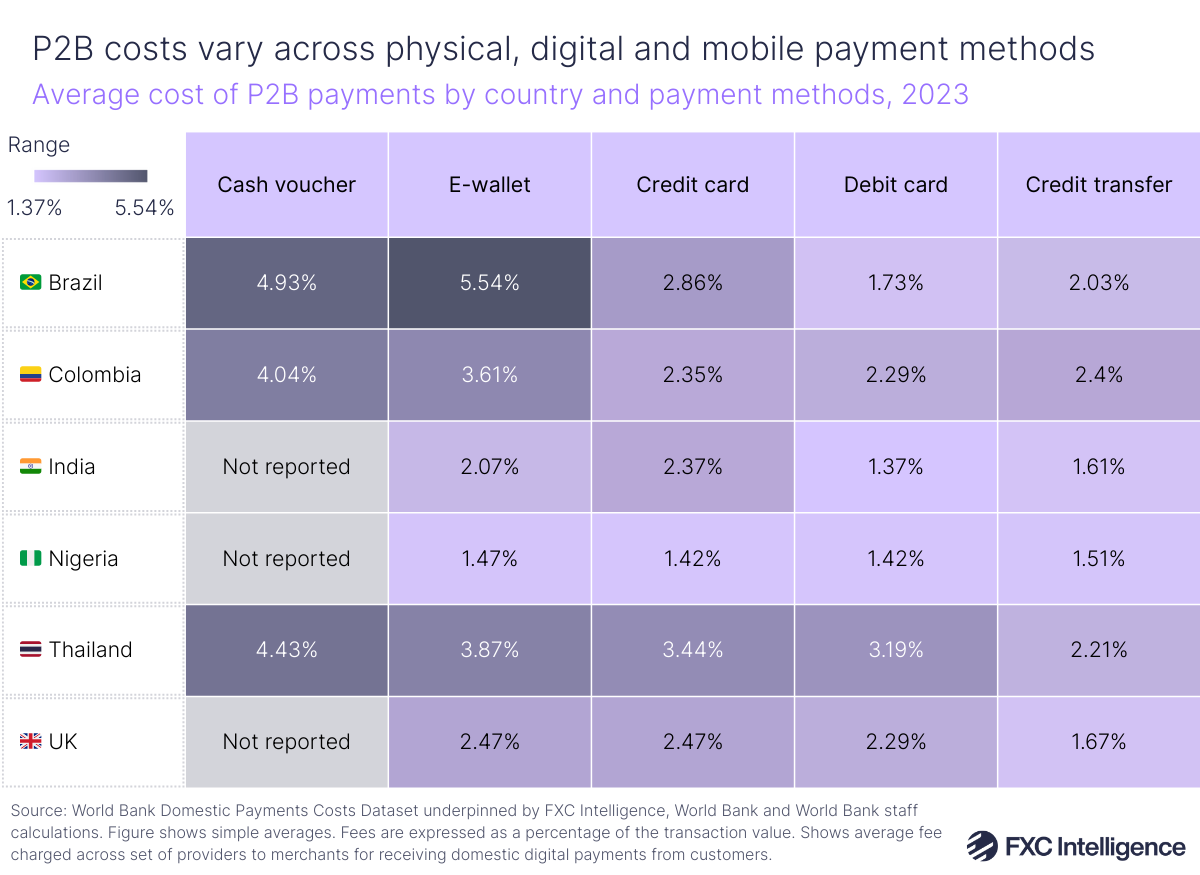
For P2B transactions, costs ranged from 1.37% (India, debit card) to 5.54% (Brazil, e-wallet) across the different payment methods, with credit and debit cards frequently offering more cost-effective payment options than cash vouchers and e-wallets. In India, e-wallet fees were cheaper than credit cards, while in the UK fees were the same for credit cards and e-wallets. Debit cards were the lowest cost payment methods across Brazil, Colombia and India and equal lowest in Nigeria with credit cards.
Data in the report showed that cash vouchers were among the most expensive payment methods in Brazil, Colombia and Thailand. However, several countries also saw relatively high costs for P2B payments made via e-wallets, particularly in Brazil, Thailand and Colombia.
While moves towards digital payments are bringing cost benefits to consumers in P2P transfers, in P2B payments merchants continue to incur higher costs for digital transactions versus in-store payments.
The significant variation in costs across the different markets shows how different regulatory frameworks, as well as the availability and maturity of payments infrastructure, is affecting pricing globally. For example, in India, the government has incentivised payment providers and merchants to adopt UPI in order to boost digital payments, including introducing a scheme to promote low-value P2B transactions. As a result, UPI payments account for a large share of P2B payments, and this payment method offers low or zero fees for merchant payments.
Fast payment systems are playing a crucial role in bringing down costs
One of the key findings of the report, spanning both P2P and P2B payments, is around the impact of fast payment systems, which allow individuals and businesses to send and receive money instantly or near-instantly, 24/7. These systems have formed a significant part of the discussion around speeding up payments globally, including the last mile of cross-border payments.
P2P transactions processed through fast payment systems have either zero or near-zero fees attached. Transfers through Brazil’s Pix have no charge, while transfers through Nigeria’s NIPs and Colombia’s Transfiya carry average transfer fees of 0.58% and 0.64% respectively. By comparison, fees for Brazil’s non-fast payment systems rise as high as 7.25%, while in Colombia fees for its ACH system average at 3.44%.

Fast payments are having a similar impact on P2B payments. The average cost to merchants for payments made through Thailand’s PromptPay system was 1.21%, versus 3.40% for payments made via other systems tracked in the report. Similarly, in Brazil, payments through Pix had an average cost of 1.18%, versus 2.68% for other systems in the study. India’s UPI also carries no charge to merchants, versus an average fee of 2.12% for other systems.
The results highlight that on a domestic level, fast payment systems are helping bring down costs in addition to speeding up payments in local markets. Across P2P services included in the study that reported speed information, the majority of transactions in Colombia, India, Nigeria, and Thailand are completed instantly, whereas Brazil and the UK largely operate on a near-real-time basis. Having said this, roughly 30-40% of P2P services in Colombia, Nigeria and Thailand did not report speed information.
Data remains crucial for tracking impact of digital payments
The report highlights that there is still a significant disparity in costs across different payment methods, highlighting that digital payments offerings are offering not just better access but lower costs to consumers on the P2P side, while on the P2B side in-store payments made with credit and debit cards are still winning in terms of domestic payment costs to merchants. Fast payments systems are also significantly reducing costs for P2P and P2B payments.
Having said this, the report also highlights in some areas incomplete disclosure of data, in particular regards to the speed of payments and merchant fees. Projects to create frameworks such as the one from the World Bank will remain critical for understanding consumer and business behaviour in the future – as will the data that underpins them.
The next step will be scaling this pilot into repeatable benchmarking so that regulators and market participants can identify where fees remain high and target reforms that improve efficiency, transparency and affordability.