dLocal’s Q1 2024 results included some strong positive notes, but faced a negative market reaction. We caught up with CEO Pedro Arnt to dig into the details and unpack the company’s longer term strategy.


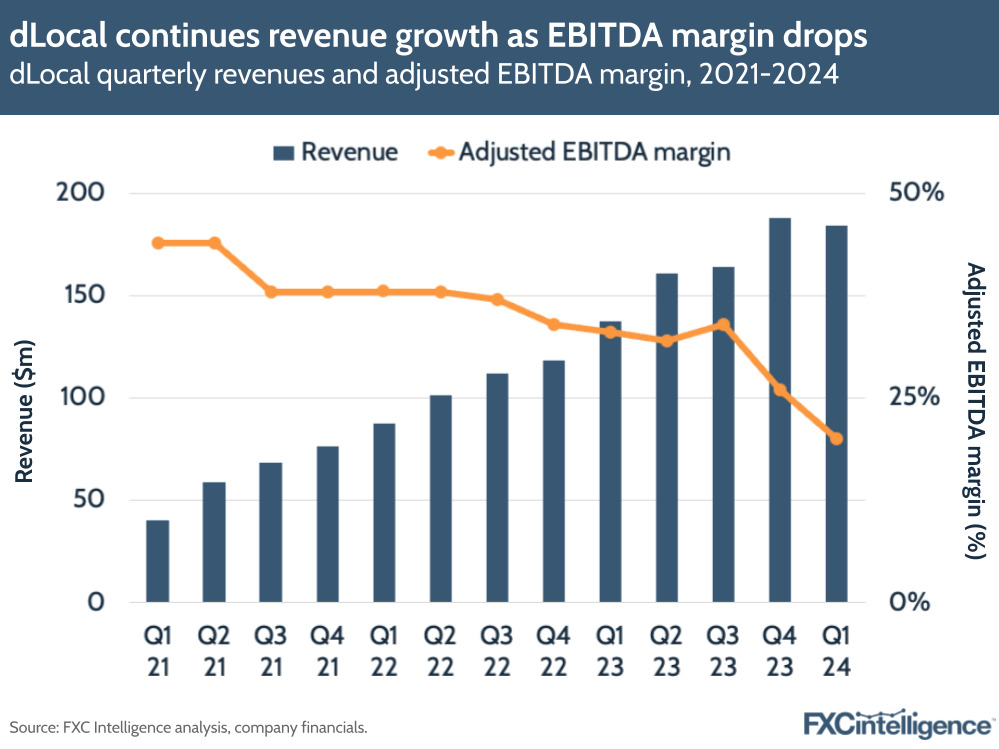
By many measures, dLocal had a strong Q1 2024. Revenue increased 34% YoY to $184m, while total payments volume (TPV) – one of its key metrics – increased 49% YoY to a quarterly record of $5.3bn.
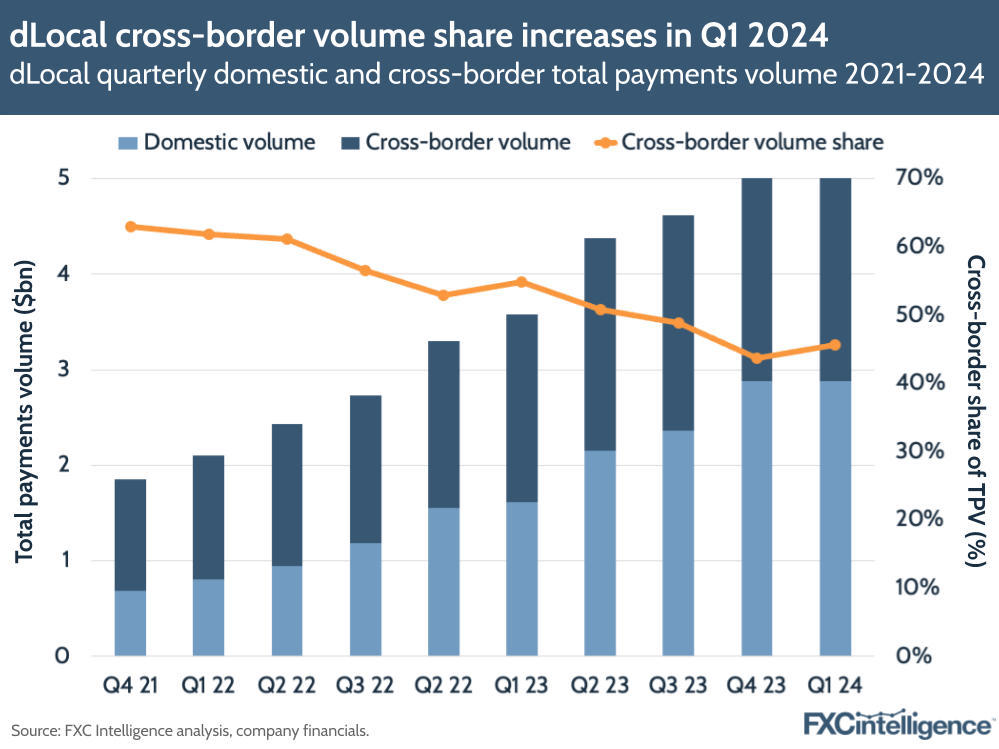
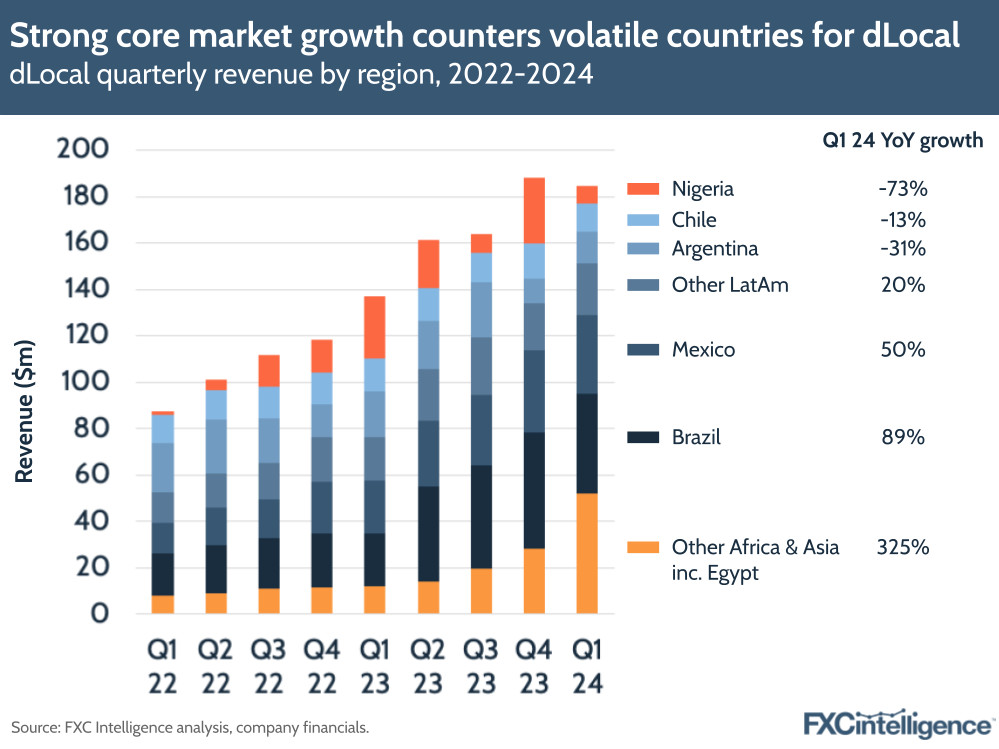
Cross-border TPV also reached a new record, growing 24% YoY to $2.4bn, while TPV in ecommerce almost tripled and remittances nearly doubled. The company’s two biggest markets, Brazil and Mexico, also saw strong growth in revenue at 89% and 50% YoY respectively, while dLocal’s Africa and Asia business grew 51% YoY.
However, some regions saw significant macroeconomic headwinds, with Nigeria and Argentina seeing revenue reductions of -73% and -31% respectively, while the company also saw a contraction in margins from one of its biggest merchants.
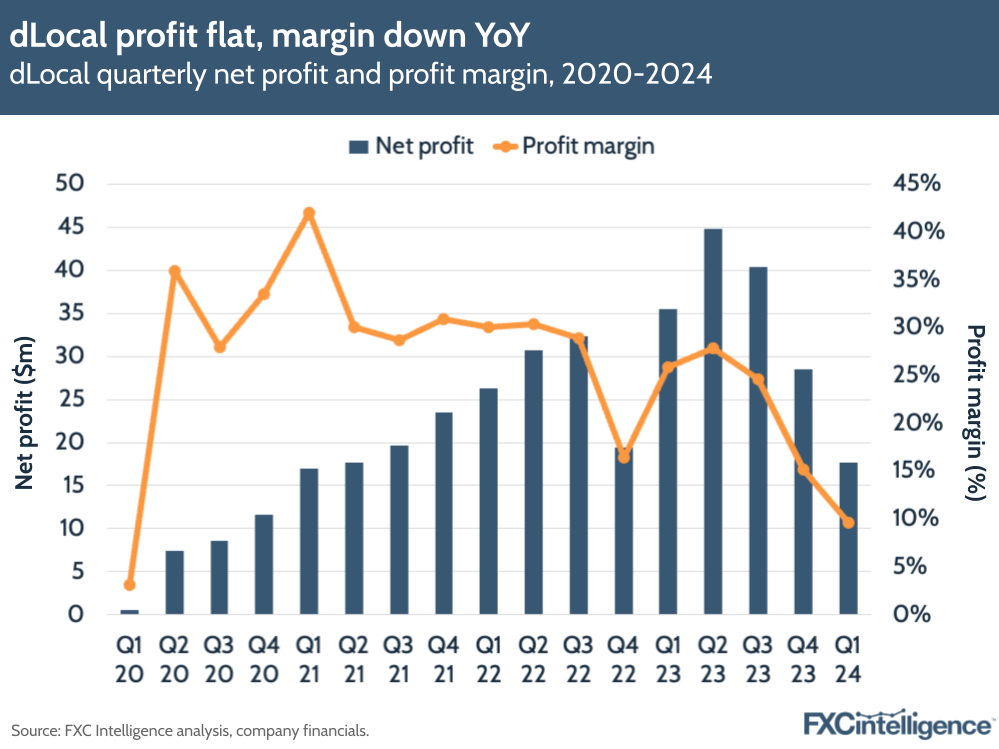
This, alongside a shift in product mix towards lower monetising pay-out volumes, led gross profit to be essentially flat at 2% growth YoY. Adjusted EBITDA also dropped by -19% YoY to produce an adjusted EBITDA margin of 20%. This prompted a strongly negative market reaction, with dLocal’s share price dropping by more than -26% in the day following the announcement.
With a complex mix of factors contributing to dLocal’s results, and a multifaceted narrative to unpick, we caught up with CEO Pedro Arnt to better understand the company’s quarter and learn how he sees the company’s longer term strategy.
Drivers of dLocal’s TPV growth
Daniel Webber:
Starting at the top, your TPV has grown extremely strongly year-on-year. What’s driving that and why do you look at TPV as one of the most important indicators for the business?
Pedro Arnt:
In a business that has a purely emerging market focus with all the macro instability that characterises emerging markets – therefore generating a lot of volatility in our financial results – TPV is the key process indicator for us because it’s how our merchants decide or don’t decide to route their payments through us.
It’s the best indication of market share and share of wallet. And as we always say, if we compound TPV growth over multiple years, that will set us up for success. The financial model follows our TPV growth.
Our TPV continues to grow 50% year-on-year, and even grew sequentially despite the fact that Q1 is seasonally weak for us now that ecommerce has become a more relevant category.
Another part of our business is our pay-outs business – we combined both pay-ins and pay-outs. Pay-outs were originally built primarily for ride hailing companies that needed to pay their drivers, or gig economy and payroll companies globally that wanted to pay workers.
More recently, we’ve begun to focus on being an infrastructure provider for global remittance players. And as a consequence of that, we’re seeing really strong traction in that new sub-vertical. Our remittances business grew nearly 100% year-on-year, and that also drove the overall volume of our pay-outs business.
dLocal’s netting-focused remittances business
Daniel Webber:
Remittances is a competitive space. What is allowing you to grow such quick market share in a space that already has a lot of players offering remittances infrastructure?
Pedro Arnt:
We’ve invested a lot in building rails when we were building this out for the other verticals. So we have really, really robust rails that meet many of the service-level requirements.
The other thing is that our monetisation capacity on pay-outs is very synergistic with our pay-ins business. In many of these corridors where netting is allowed by the regulator, we can make a very interesting margin on the liquidity that the matching of pay-outs and pay-ins allows for us.
That’s what we refer to as netting. So what is traditionally an FX transaction that has to go through a global banking partner or a global broker when netting is allowed, then the FX transaction simply becomes two movements on our ledger and we get to keep the entire FX spread or use that entire FX spread to quote very, very attractive rates to our partners.
That allows us to be extremely competitive on the FX that we can quote for the pay-out remitters because we can make a decent margin on the pay-in as well. So the fact that our business combines both the pay-outs and the pay-ins is highly synergistic and makes us very competitive in our offering.
Growing cross-border volume
Daniel Webber:
Your share of cross-border volume jumped again. Why is that a good sign for the business, and what is driving it?
Pedro Arnt:
We started as a cross-border company – that’s really our origin – and it’s our higher take rate flows as well.
We’ve been incredibly successful orchestrating payments for our merchants locally too. So over the past years, our local-to-local processing has grown to a point where it’s now slightly larger than our cross-border, but cross-border is really our sweet spot.
Last quarter, cross-border TPV had actually decelerated slightly, and it’s now grown again. Cross-border TPV was record high in Q1 and actually grew sequentially by nearly 10% QoQ. So it’s good to see that business, which has a higher take rate and is where we think we add the most value to our merchants, accelerating once again.
Interestingly enough, it was actually a seasonally weak quarter because a lot of the cross-border customers are ecommerce merchants that really have higher volumes in Q4 than Q1. So this was the strength of the business in Argentina beginning to pick up again.
Argentina had had a low in terms of cross-border. In the fourth quarter, the country was going through a lot of macro turbulence, an election, a devaluation, which paused cross-border flows there. That’s begun to pick up again. And the remittance business, which is that added liquidity that we’ve had, has also allowed us to quote aggressive FX and that’s helped pick up the volumes there.
Larger merchants and margin pressure
Daniel Webber:
Let’s talk about margins and pricing. You’re increasingly working with some of the largest merchants in the world, which brings positives but who can be more aggressive on price. Talk us through the take rates and positives of working with these larger merchants.
Pedro Arnt:
It’s a double-edged sword. We’ve been incredibly successful accompanying one of our very, very large global merchants in their go-to-market and growth strategy across over seven geographies in Latin America. That’s been great in terms of growth: we have what we consider to be a very solid share of wallet with them and a great partnership.
Part of that great partnership is that as their volumes grow significantly – and just to give you an idea, this merchant has become more than twice the size of our second-largest merchant, so significant concentration with them – consequently we’ve renegotiated prices.
That’s been a headwind in the quarter. It cost us, we’ve quantified it as roughly 130 basis points of gross profit margin. That’s a hit quarterly and it’s one of the major causes of why gross profit is flat year-on-year.
But in a few years time when we look back, we’ll realise that this kind of pricing negotiation allows us to continue building a relationship with them globally. It puts us in a pole position to continue gaining new markets with them and accompany them beyond Latin America. So the way we look at these is sometimes you need to take a loss in one quarter, in one market, so that you can have a deeper partnership and grow together globally over longer periods of time.
Variations in geographical growth
Daniel Webber:
Let’s cover geographies. Which markets have been going more and less well, and what’s driving that?
Pedro Arnt:
When we look at year-on-year growth to adjust for seasonality, Brazil and Mexico, our two largest markets, continue to deliver on revenue growth. Brazil, nearly 90%, Mexico over 50% – extremely strong growth year-on-year.
On the flip side, you have markets like Argentina or Nigeria where there was a very, very tough comp in 2023. Primarily Argentina, where throughout 2023 the country had capital controls and we were one of the few providers of liquidity in that market, in part because of the netting we were referring to previously.
Therefore, FX spreads become very attractive in those markets during those periods. The country has since devalued its currency, as has Nigeria. So a lot of that FX revenue stream has compressed significantly, and that makes for strong negative year-on-year revenue in Q1 for Argentina and Nigeria.
dLocal’s share buyback programme
Daniel Webber:
You’ve announced a share buyback programme. Can you add some colour on that?
Pedro Arnt:
We believe very much in the opportunity that we have in front of us and believe that we’re better positioned than most others to capture it.
We have incredibly strong payments rails across over 40 emerging markets. We believe that those markets are going to be some of the most attractive markets over the long run. And so, given the negative reaction that markets have had to short-term results, we believe that the cash that the business generates – and it still is a highly cash-generative financial model – has a very positive return profile of capital allocation and buying back our own shares at these levels.
The board has approved a $200m share buyback for us to carry out, and it’s a sign of the confidence we have in the business going forward.
Daniel Webber:
Pedro, thank you.
Pedro Arnt:
Thank you.
The information provided in this report is for informational purposes only, and does not constitute an offer or solicitation to sell shares or securities. None of the information presented is intended to form the basis for any investment decision, and no specific recommendations are intended. Accordingly, this work and its contents do not constitute investment advice or counsel or solicitation for investment in any security. This report and its contents should not form the basis of, or be relied on in any connection with, any contract or commitment whatsoever. FXC Group Inc. and subsidiaries including FXC Intelligence Ltd expressly disclaims any and all responsibility for any direct or consequential loss or damage of any kind whatsoever arising directly or indirectly from: (i) reliance on any information contained in this report, (ii) any error, omission or inaccuracy in any such information or (iii) any action resulting there from. This report and the data included in this report may not be used for any commercial purpose, used for comparisons by any business in the money transfer or payments space or distributed or sold to any other third parties without the expressed written permission or license granted directly by FXC Intelligence Ltd.