
We break down the content shared by B2B payment providers on LinkedIn to explore how they are using the platform and identify common strategies and trends.
While popular across the cross-border payments industry, players in the B2B space specifically have seen LinkedIn become a key tool for engaging with prospective audiences and demonstrating their authority.
The content that these companies share on the platform speaks not only to the topics that their company is increasingly focusing on, but also to how they are conveying this to prospective customers and business partners.
In this report, we’ve analysed the LinkedIn posts for B2B payments providers across a three-month period to highlight which topics, formats and content types they are posting to give insights into their marketing strategies using the platform, as well as showing how each topic fares on engagement.
While there are several factors that may affect how LinkedIn users engage with posts, this analysis showcases how some of the key B2B providers in the space are devoting their time to LinkedIn output, as well as a sense of which types of posts have tended to see more traction in the form of likes, comments and reposts. This therefore gives insights that can be helpful for B2B payments providers looking to enhance their communication strategies on Linkedin.
Methodology for report
For this report, we analysed the LinkedIn posts published by 14 companies that are primarily focused on the B2B space, spanning both business-to-business payments providers and infrastructure-providers selling to businesses.
These companies are some of the leading players in the space (featured in FXC’s Top 100) and published frequently enough on LinkedIn to analyse their posts effectively, while also spanning a wide range of customer, product and regional focuses, though they specifically have a focus on marketing to businesses on LinkedIn.
The companies included in the report were: Airwallex, Banking Circle, Convera, Corpay Cross-Border Solutions, Ebury, Flywire, Moneycorp, Nium, Onafriq, Rapyd, TerraPay, Thunes, Transfermate and XTransfer.
We pulled together LinkedIn posts made by these companies over a three-month period (from 1 April to 30 June) and categorised them based on various factors, including the type of content being shared, the topics the posts cover and what formats they use. We excluded any reposts made by the company that didn’t include additional context to avoid including posts that might not fully reflect each company’s chosen framing and editorial context.
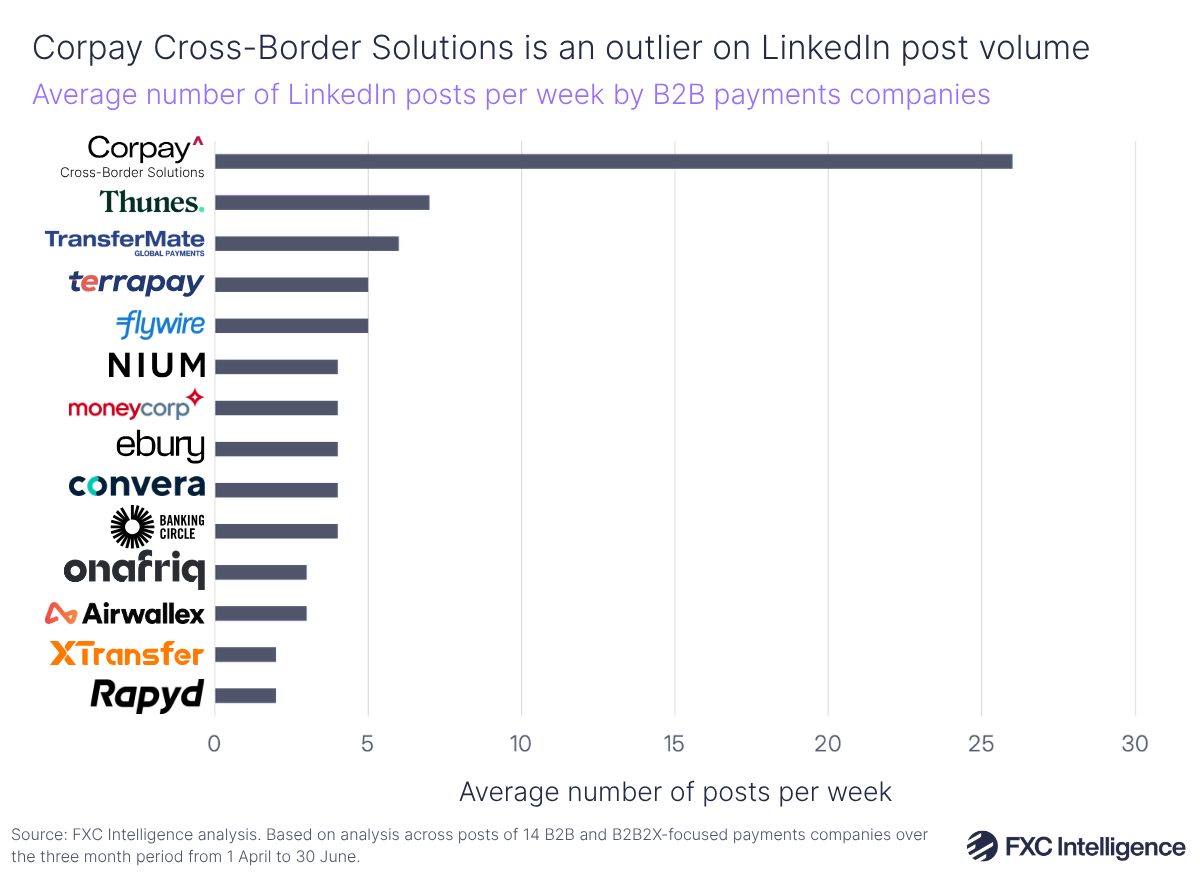
B2B payments companies post with varying frequency on LinkedIn, however Corpay Cross-Border Solutions (the specific cross-border arm of Corpay) was a clear outlier across the companies, posting 341 times on the platform over the three-month period, or roughly 26 times a week.
The company had a specific focus on analysis articles, with these being published as the articles went live on their website. Excluding Corpay, the average number of posts per week across the assessed companies was 4, with 18 posts per month. This covered a range, with some providers posting more frequently and some opting to post less.
The key takeaway here is that not all providers are sharing the same volume of posts on LinkedIn. This should be borne in mind when considering each company’s output devoted to various topics, content types and formats discussed in this report, as while a particular company may be devoting a higher share of its posts to a certain content type, this does not necessarily mean that it is posting more in that category than other companies with a higher overall volume of posts.
The prominence of event-based content on LinkedIn
Aside from the topics that companies in the space post about, there is a wide variety of approaches to the type of content being shared, either directly or being linked to.
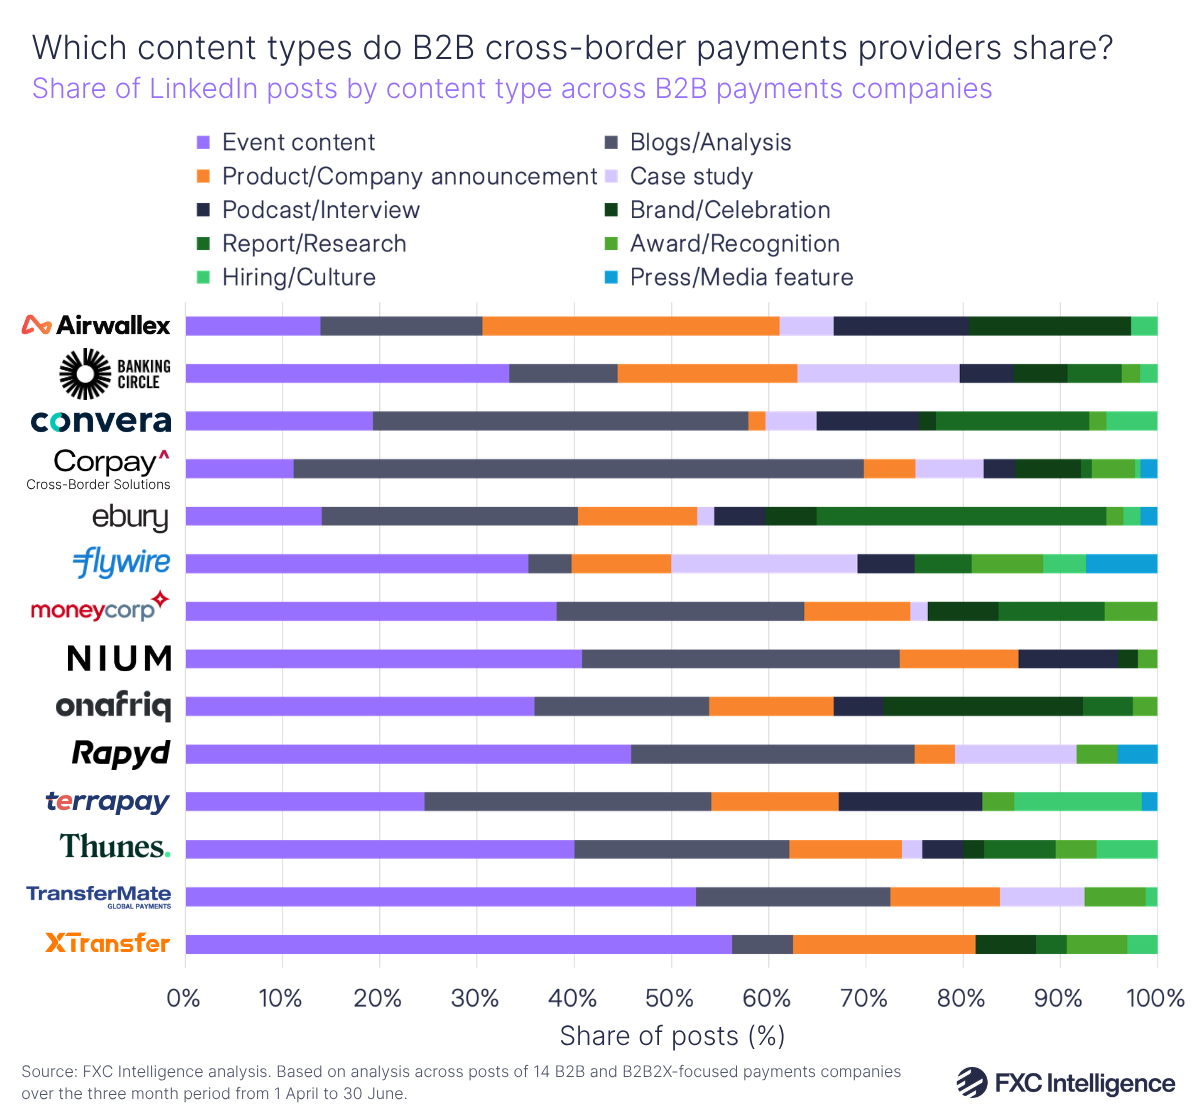
A large share of posts across the assessed companies was occupied by event-based content, referring to posts tied to a specific named event such as conferences, summits, webinars or trade shows.
Companies approached event-related content in various ways. One of the most prominent was companies explicitly using event posts to directly showcase products or capabilities as a pitch – for example, Banking Circle telling users they can contact their team to find out more about its single-API offering access for global payments or Thunes talking about its launch of real-time payouts into the US.
Another method was speaking about key takeaways for the industry, either by opening the post with a broad industry analysis that was then linked back to the event or using the post to recap key takeaways from events. Finally, some posts would mainly be logistical or promote attendance, telling users that the company or certain team members would be at a certain booth or counting down to the event in question.
Event posts were frequently linked to other companies, either referring to co-branded partnerships and sponsorships or framing events around the hosting organisation. For example, TerraPay attending the BAFT (Bankers Association for Finance and Trade) Global Annual Meeting or Onafriq attending the KPMG Africa Private Enterprise Venture Summit. Companies would also in some cases name co-panelists from other companies at the same event including peers, partners or even direct competitors, effectively positioning themselves in the conversation around the industry rather than just their own presence within it.
Event-related content accounted for over 10% of the post share across all the providers and over a third of the post share for eight providers, highlighting the specific focus on this type. This particular post type is likely to have been partly inflated by seasonality, with major industry events ramping up throughout the year. There was also a significant focus from several providers on inviting customers to company-specific events and webinars.
How do users engage with content the company is posting?
We collected data on the number of likes, comments and reposts across the posts made during the period. There are a significant number of factors that can affect how users may engage with posts across different companies, including their specific reach in terms of followers, the potential of reposts to spur action on posts and how the LinkedIn algorithm chooses to show content to viewers.
Having said this, looking at the average total engagement (likes+comments+reposts) across the different content types gives a sense of which types of content users are tending to engage more with, and we found that this isn’t always aligned with the extent to which companies share them as part of their overall LinkedIn strategy.
We found the average total engagement across all of the companies’ different post types to see how these compared, giving a range from 26 (the average engagement of the lowest performing content type, blogs and analysis) to 133 (the highest performing type, products and company announcements).
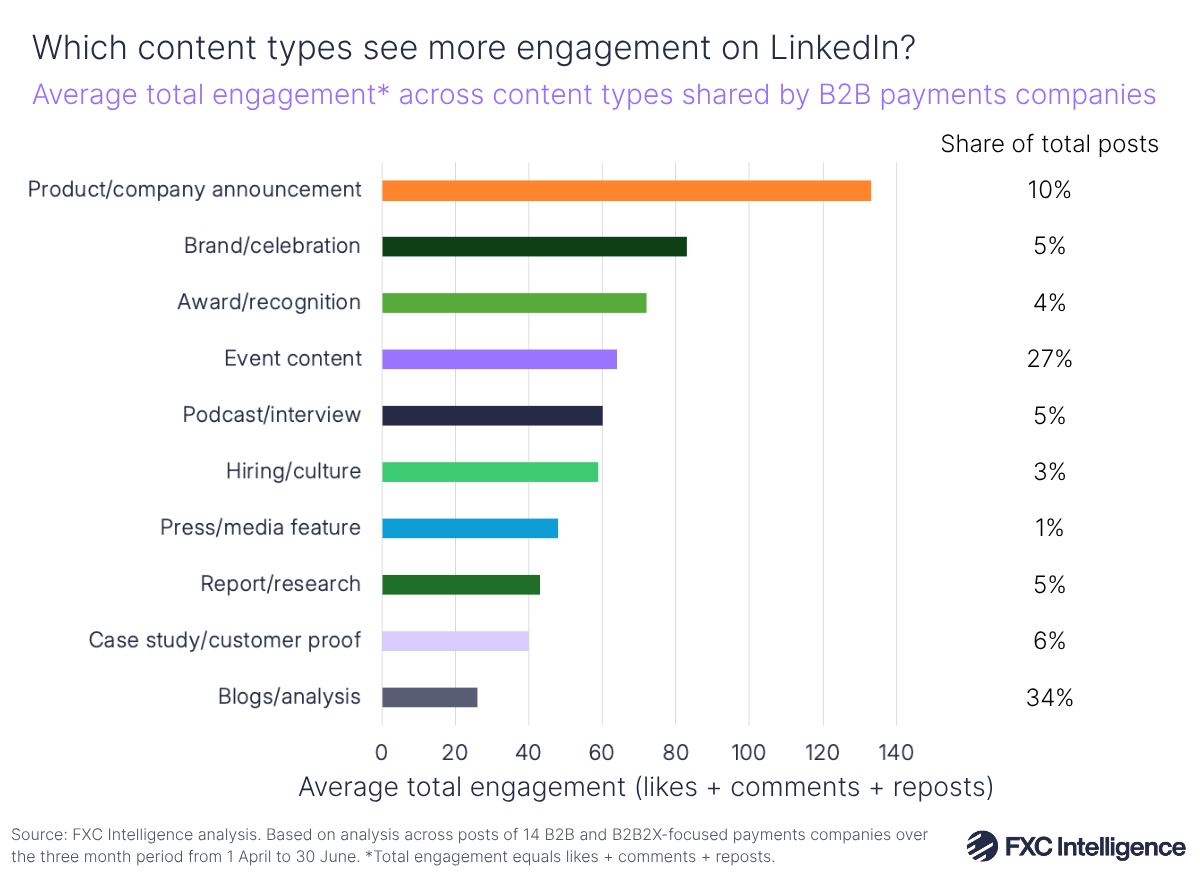
For example, in total across all of the companies’ posts, 34% were categorised as blogs or analysis. However, in terms of total average engagement, these saw the lowest overall average engagement score at 26, alongside case studies and reports and research. It should be noted that Corpay’s high volume of blogs and analysis (accounting for 57% of posts), skewed this figure, with engagement ranging from 0-55 on these posts. Excluding Corpay, the total engagement average for blogs and analysis would have been 49, though this would still place it in the bottom three content types in terms of engagement.
By comparison, product and company announcements accounted for 10% of posts overall, but saw the highest average engagement score at 133. Another high scoring category for total engagement was brand and celebration posts, which referred to posts that marked moments that were purely societal or cultural in nature and not related specifically to the companies’ core business or offering – including posts such as holiday greetings, celebration of sponsorships (e.g. sports teams) or celebrating another company’s achievements. These posts accounted for 5% of the total analysed, but saw an average total engagement score of 83.
Companies also saw relatively higher engagement around awards and recognitions, in which the company noted it had won, ranked or been formally recognised by another third party such as an awards body or industry list (such as FXC Intelligence’s Cross-Border Payments 100). These were 4% of the total posts, but saw an engagement score of 72, putting them in the top three categories in terms of average engagement. Meanwhile, event content accounted for 27% of posts (the second-highest share by category) and saw a total engagement of 64, placing it fourth by engagement.
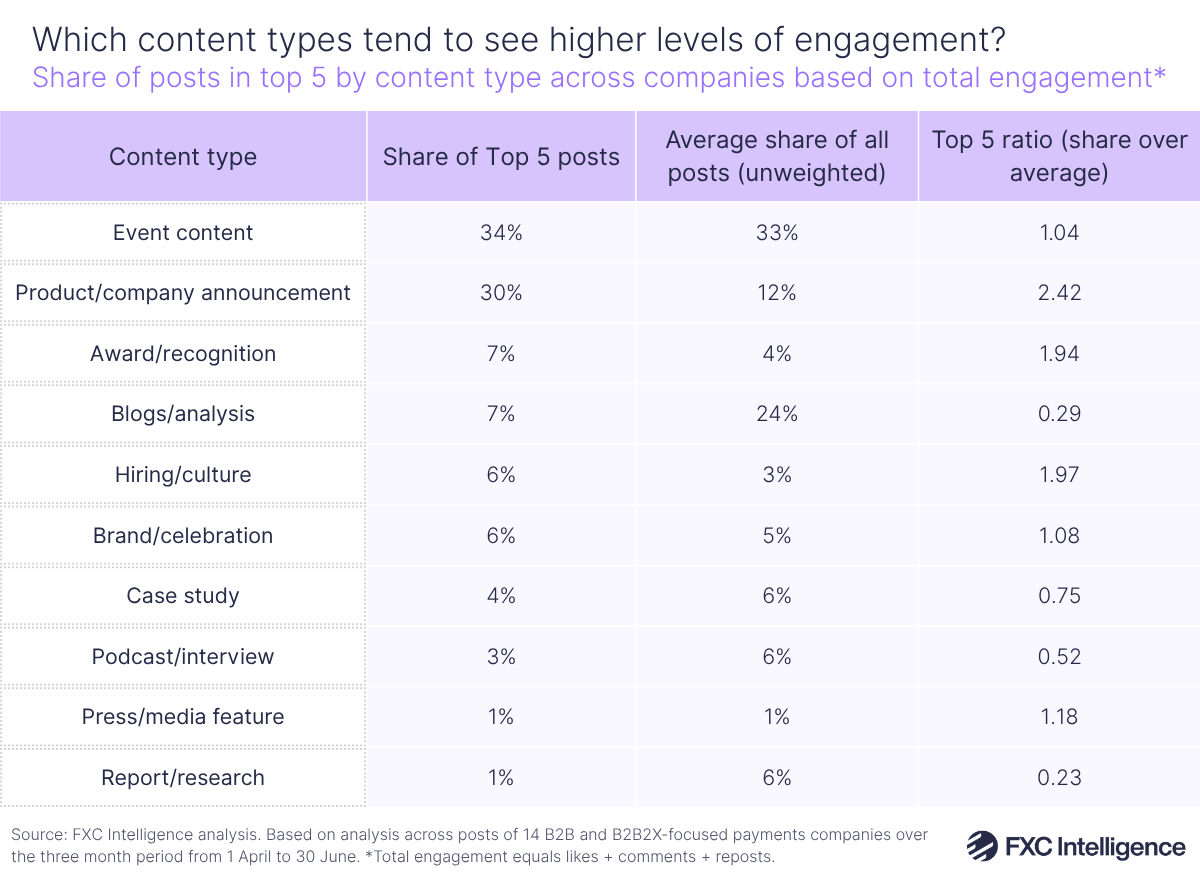
When considering just the top performing posts in terms of total visible engagement (likes + comments + reposts), certain post types have tended to rank in the top positions more than their normal posting rate would suggest, showing that if positioned in the right way these posts can have significant value for companies.
For each of the 14 companies, we collected the five posts with the highest total engagement (with the context of just that company’s posts). These were pooled into a total of 70 posts and categorised by content type, before being compared against each content type’s normal posting rate, averaged across all of the companies equally (so that no high-volume company could shift the comparison).
We then calculated a ratio by dividing the share of top five posts for each content type against that type’s average share of all posts to give a ratio, which highlights whether a content type is performing among the top five as often as its normal posting rate would predict (i.e. a ratio of 1).
Across the 14 companies, event content featured the most prominently in top five posts, reflecting the volume with which it is posted. However, product and company announcements overperformed significantly in terms of total engagement, accounting for just 12% of posts on average but appearing in the top five posts for companies 30% of the time.
Meanwhile, blog and analysis posts, which accounted for an average of 24% of posts across the companies, appeared in the share of top five posts just 7% of the time, further confirming that their level of engagement has not always reflected how often they are posted.
Aside from product and company announcements, two other categories have high top five ratios, implying that they overperformed in top ranking posts when compared to how much they are posted. These were hiring and culture-related posts, which referred to recruiting, employer branding or internal culture, and award and recognition posts.
While the data does not account for individual customer’s reach or LinkedIn’s algorithm for showing posts, the pattern highlights that content showcasing a company’s own concrete achievements – for example, funding rounds, major partnerships or product milestones – tends to have ranked more highly in terms of total engagement versus other content types.
Looking at the ratio column as a whole, the six content types with a ratio sitting at or above 1 – including products and company announcements, hiring/culture posts, awards and recognition, press and media features, brand/celebration and event content – all seem to highlight specific moments in time and the impact on the company posting them. Meanwhile, content types with ratios sitting below 1 – case studies, podcasts and interviews, blogs and analysis and in-depth reports – are all more focused on ongoing editorial or industry-focused content.
The implication from this is that audiences on LinkedIn appear to engage more with content that is speaking about particular instances of things that have happened to the company or as a result of its actions, versus content that is focused on showing how the company is thinking about particular topics in the space, even though the latter is often what companies post more about.
What formats are LinkedIn posts being shared in?
We also analysed the share of posts for each provider that were text-only or came with the following formats attached: image(s), video, PDF/document (shown as a carousel) and polls.
While the vast majority of LinkedIn posts analysed contained purely images, some companies took different approaches to the media that they shared alongside their posts. Airwallex and Banking Circle were two companies that are using video content significantly more than other companies in the space, using this to accompany interviews and podcasts or in lieu of static images.
Meanwhile, several of the companies, including Ebury, TerraPay, Convera and Thunes and to a lesser extent Banking Circle and Nium, are using PDFs to create carousel images in their posts. These allow users to scroll through multiple images, often to see a summary of key insights from reports, see a series of standalone graphics that tell a trend story or highlight multiple images from an event.
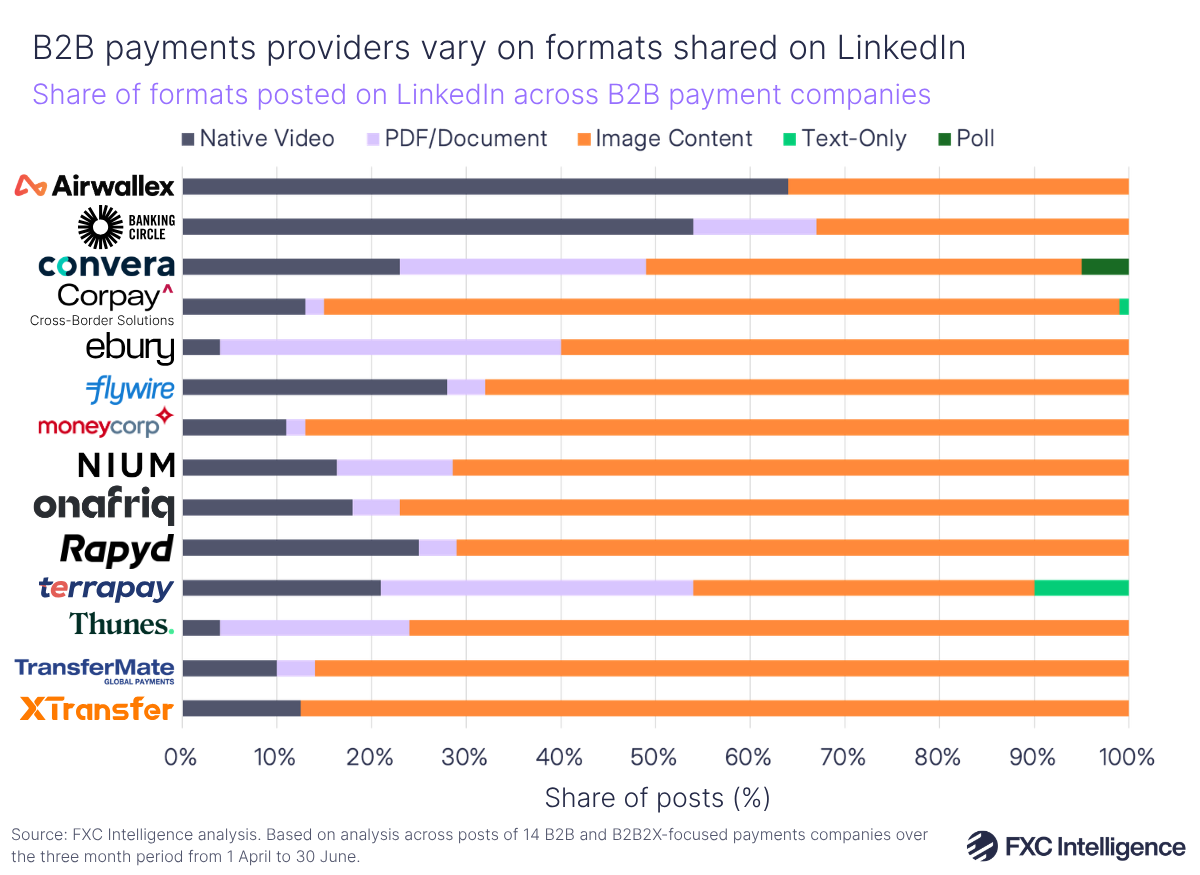
On average across the providers, image content was the most frequently shared post type across the different formats, with 71% of posts containing just images versus 18% for video content and 10% containing PDFs/carousels.
In alignment with a significant portion of the content being related to events, image content often showed companies participating at events or panels, but also included specific instances of graphics showing statistics, information or contributors linked to specific analysis, or alternatively having a specific theme – for example, partnerships with sports companies or related to the World Cup having a football theme – or celebration posts related to holidays having a relevant image.
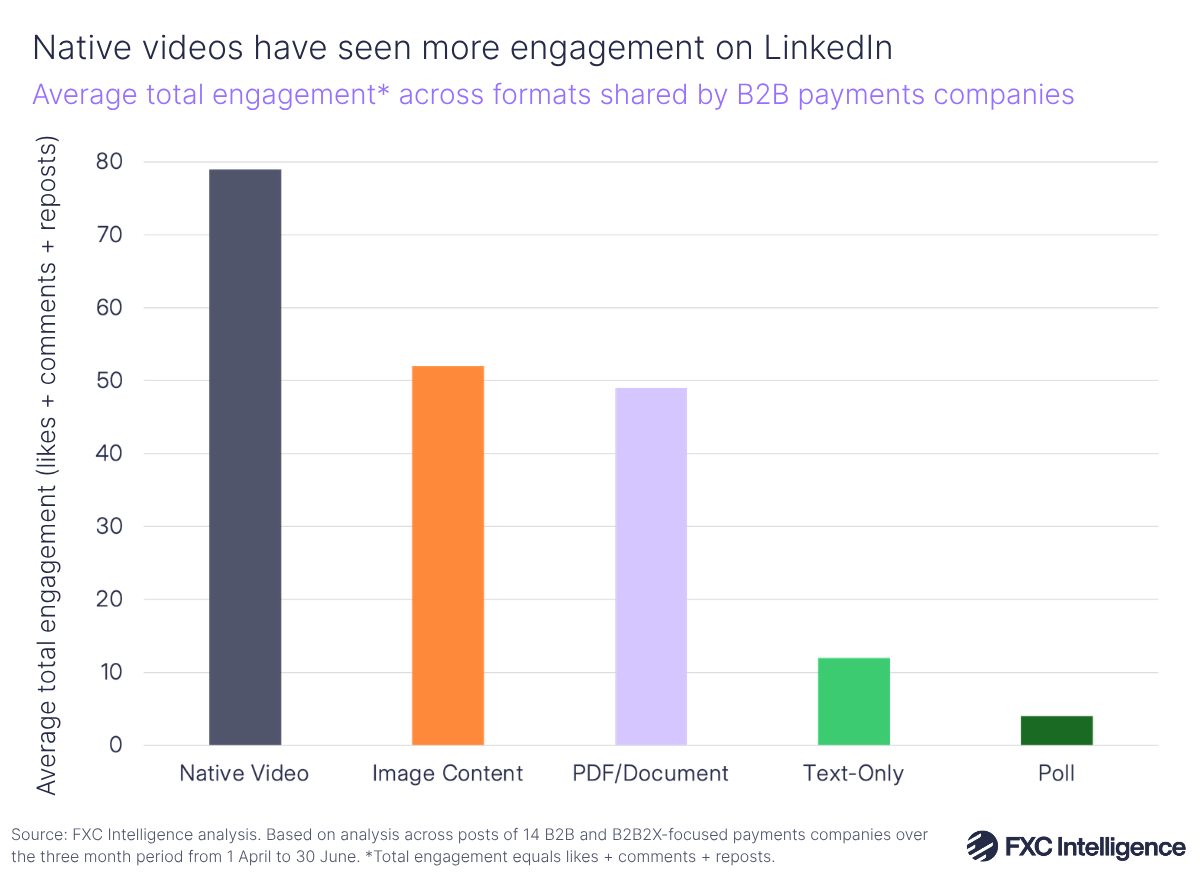
Based on averages taken across the different companies, native videos scored particularly high in the number of total likes, comments and reposts accrued versus the other content types, with an average engagement of 79 versus 52 for image content and 49 for PDF/document content.
Text-only and poll-related content (i.e. asking LinkedIn users a specific question) meanwhile, tended to score lower in terms of engagement (with respective averages of 19 and 4), though these were much less frequently used as part of posts, showing a clear directive towards visual content amongst companies.
What topics do different companies post about?
Across the companies, we identified a total of 17 different recurring topic categories, with these spanning areas of interests for different types of customer ; more specialised focuses on areas of technology; and topics referring to internal company growth, milestones and successes. Posts made by players in the space often covered more than just one topic.
The breakdown of different topics across each company varied significantly, with some companies seeing a significantly higher share of posts on some topics than others.
Some of the topics covered make sense given the context of the companies posting about them. For example, companies whose core business is providing underlying payment infrastructure and rails that banks, fintechs and other payment providers rely on to move money across borders – namely Banking Circle, Rapyd, Thunes, TerraPay and Onafriq – understandably saw a significant portion of their posts talking about cross-border infrastructure and rails, reflecting the fact that this is the product that they are selling.
Meanwhile, companies whose core business is helping businesses directly manage and move money internationally – such as Convera, Moneycorp, Corpay Cross-Border Solutions and Ebury, more frequently referred to topics around customer issues related to FX and treasury, spanning topics including currency exposure, hedging, liquidity and multicurrency accounts.
Certain companies’ specialisations emerged in their posting topics. Rapyd seeing 17% of its posts relating to payroll and payouts for example, reflects the company’s role as a provider of rapid disbursement services amongst other offerings, while Flywire saw 50% of its posts focusing on education payments and 22% referring to travel payments, reflecting two of the four segments this company focuses on as part of its vertical-specific company approach.
Additionally, 9 of the 14 companies also referred to sports and brand sponsorship deals in their posts, with Airwallex seeing the highest share of its posts related to this (19%), followed by 11% for Corpay Cross-Border Solutions. The connection to sport in the industry amongst some of the world’s biggest banking and payments players was reflected in our recent piece finding that 88% of countries in the World Cup had at least one sponsor that is either a bank, a fintech or another form of non-bank player.
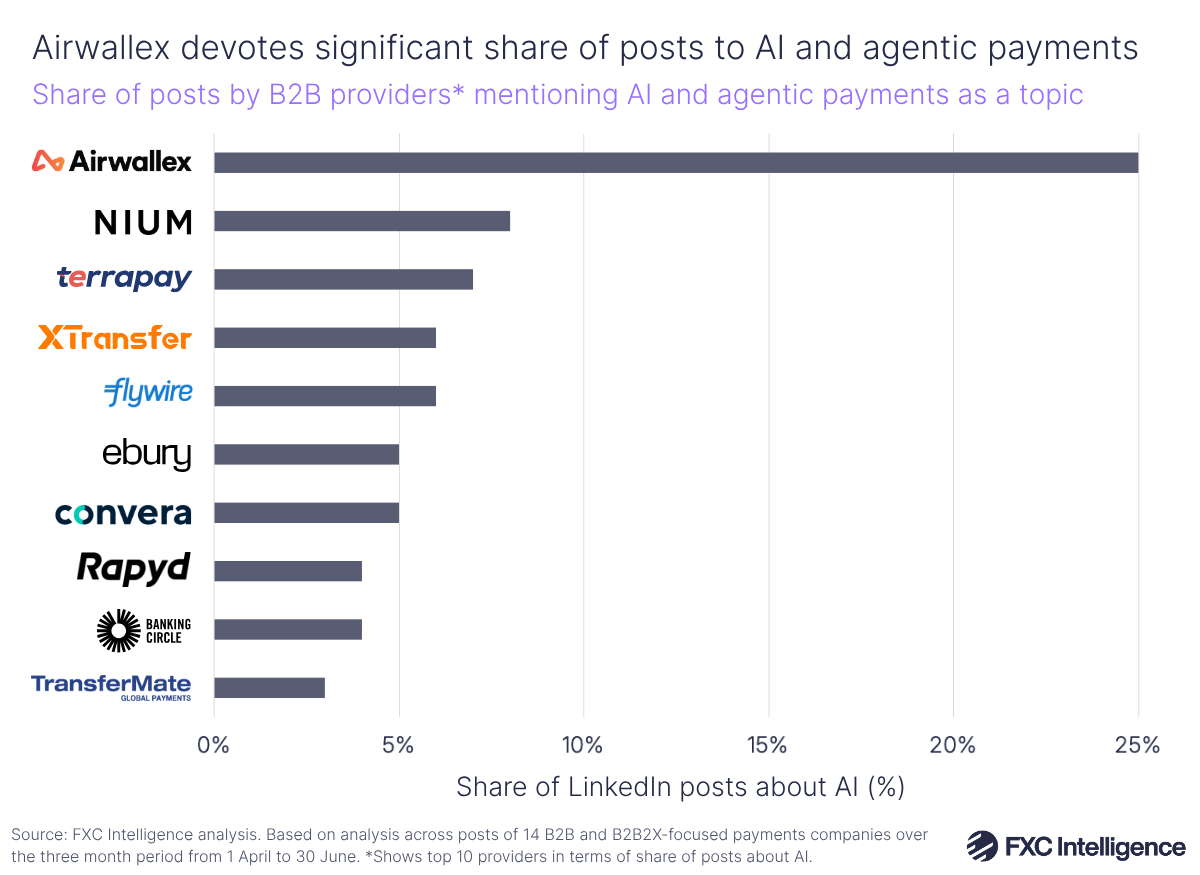
Our analysis also found particular variation across two major topics for the space at the moment: AI/agentic payments and stablecoins. In terms of the share of its total posts, Airwallex emerged as a major proponent for AI on LinkedIn, with around a quarter of its posts over the assessed period referencing either AI or agentic payments. The company seeing the next highest share of posts referencing AI and agentic payments was Nium at 8%, while the lowest share of posts related to these topics was for Moneycorp and Corpay, both at 2%. Excluding Airwallex, on average companies across the report spoke about AI in 4% of their posts.
Airwallex’s focus on this area appeared to reflect a focus on its products, with references to Airi, an AI-powered consumer digital wallet built into its payments platform, as well as discussion of how AI agents are significantly speeding up development for its engineers. The company has also talked about AI as a recurring theme in the podcast series it shares on LinkedIn.
Some other companies did mention AI specifically in relation to their operations. For example, Ebury spoke about how it would use its recent £550m investment to help augment AI-driven workflows for faster processing, while Transfermate featured in a third-party case study discussing the company’s approach to AI-assisted compliance workflows. However, AI-related content elsewhere in the sector was primarily driven by general industry commentary, with Nium, Banking Circle and TerraPay, for example, mentioning the product in events and panel appearances with no specific product named.
While every player analysed over the period had at least one post on the topic of AI, a significant portion of it remains at the macro commentary level, showing that the majority companies are recognising its significance to a wider audience but aren’t yet mainlining its impact from a product-specific standpoint.
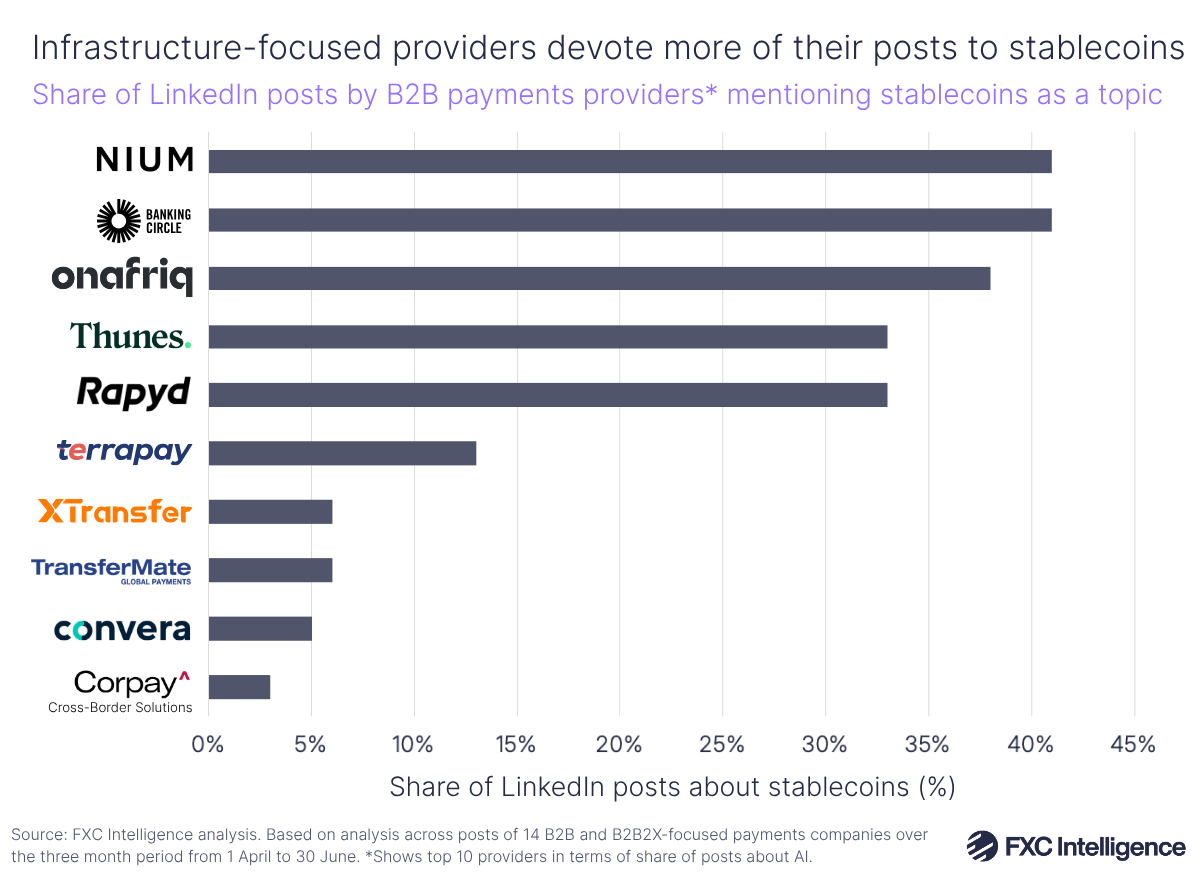
Similarly, references to stablecoins and digital assets were extremely mixed across the group. Infrastructure-focused companies such as Banking Circle, Nium, Rapyd and Onafriq had a significant share of their posts address this topic (41% for Banking Circle and Nium, 38% for Onafriq and 33% for Rapyd), while other B2B providers posted far less.
This divide seemed to reflect significant infrastructure investment from providers in the space, but was also influenced by new partnerships that had been formed during the period analysed. Banking Circle and Nium, for example, featured posts on named stablecoin-related partnerships, with Banking Circle partnering with Stripe-owned infrastructure provider Bridge to help power its global payments capabilities, while Nium highlighted deals with Coinbase and Circle.
Rapyd and Onafriq’s stablecoin content, meanwhile, mentioned stablecoins as part of event appearances, webinars and general industry positioning, with Onafriq framing stablecoins around what African payment infrastructure specifically requires, while Rapyd tied stablecoin adoption to its iGaming-focused customers.
The vast majority of the B2B providers we analysed have either announced partnerships, launched products or in some way shown they are engaging with the stablecoin and digital asset space, but not every company devoted as many of their own LinkedIn posts to the topic over the period analysed.
For example, Convera and Flywire posted about stablecoins and digital assets in a smaller fraction of their overall posts (5% and 1% respectively), despite both companies having formed significant stablecoin partnerships – Convera partnered with Ripple to deliver crypto-enabled payment and treasury solutions for cross-border payments in March 2026, while Flywire partnered with BVNK to commence a stablecoin payments partnership last year.
Key takeaways
The data from our report points to key takeaways for providers in the B2B payments space.
In terms of how users tend to actively engage with Linkedin posts (either liking, commenting or reposting), the average levels of engagement across different content types and formats don’t always align with the extent to which they are posted.
Based on the patterns analysed, users are more likely to engage with content in which something has happened or is happening to a company (e.g. product launches and company announcements, events or awards/recognition) versus more editorial content, such as blogs, analysis, research and reports. Also, while the B2B payments space is heavily focused on image content versus video content, on average users have tended to engage more with video content.
While the payments topics that B2B providers tend to post about are often aligned with their business offering, in the case of stablecoins and AI there is significant variation in how much companies post, though this doesn’t necessarily reflect the extent to which they have made progress in these areas. Having said this, the fact that all 14 of the companies have posted about AI over the three-month period and 11 have posted on stablecoins and digital assets highlights that these topics are of growing interest for the industry.