Swift recently announced that it was changing the name of its longstanding RMB Tracker to become the Global Currency Tracker, which it says “better reflects the breadth of the Swift network and the diversity of currencies that travel across it”. With this in mind, we take a look at changes in key data from the tracker over the past few years to see what it says about cross-border payments beyond the US dollar.
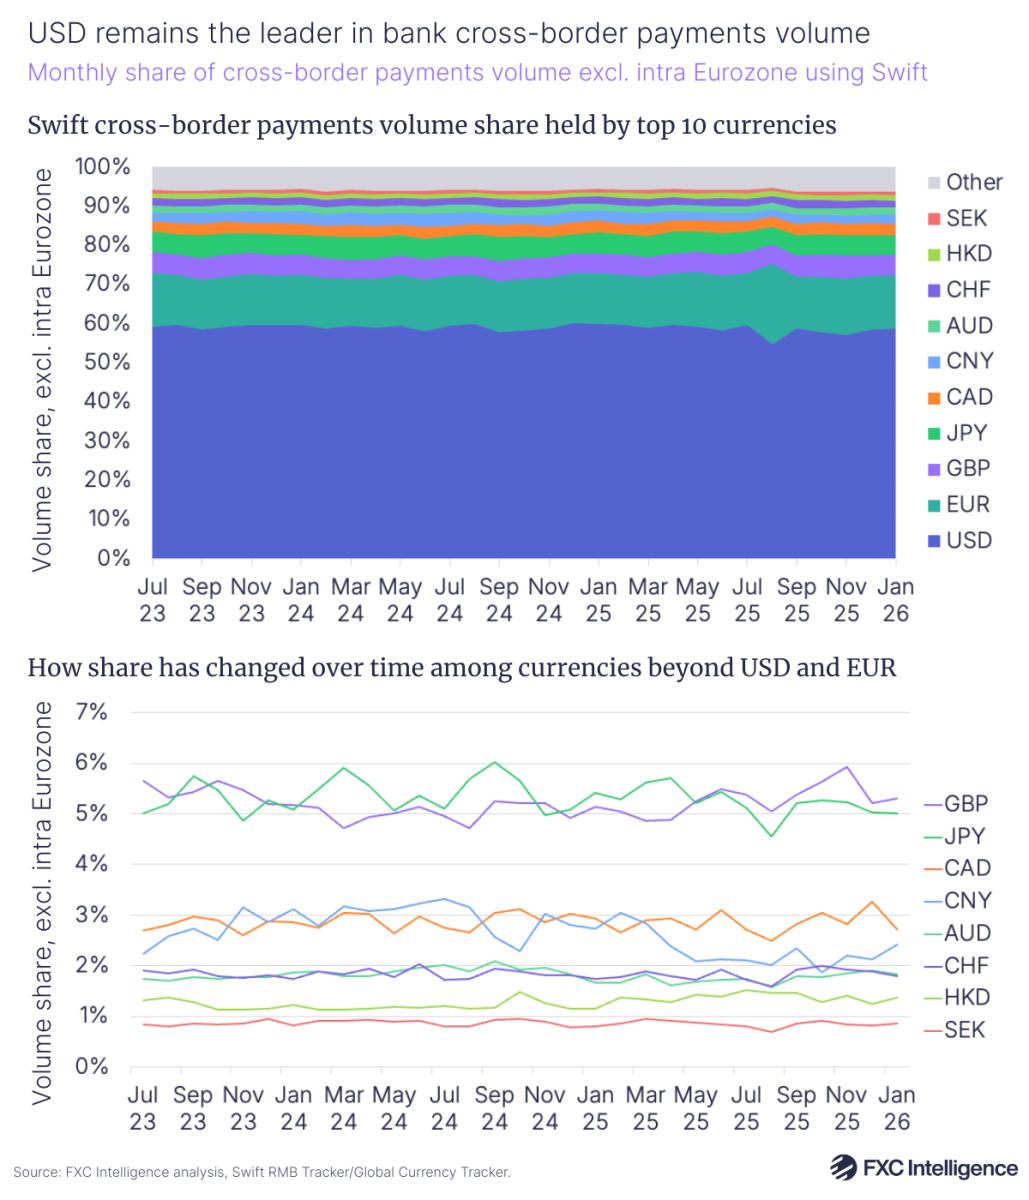
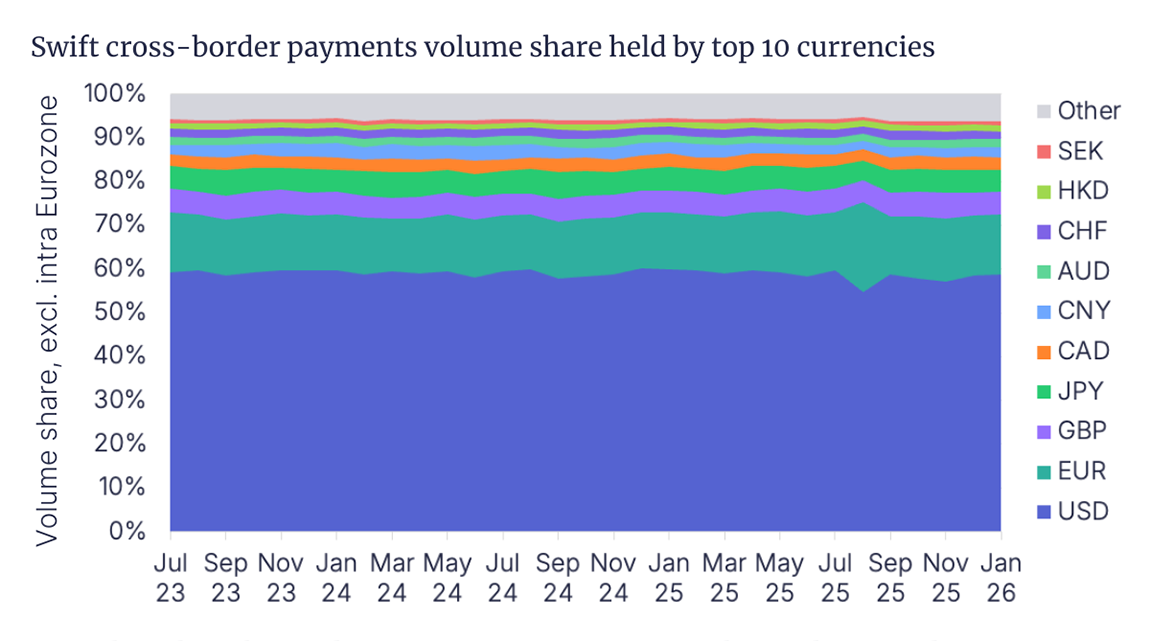
We looked specifically at the monthly share of cross-border payment volumes using Swift excluding payments within the Eurozone between July 2023 and January 2026. This is because differences in data collection methods prior to this mean the data is not as directly comparable.
During this period, the USD share of these payments, which are largely initiated via banks, remained fairly stable at around 59%. However, there is evidence of a modest decline, with the average of the most recent six months being around 1.8 percentage points lower than that of the same six months two years previously.
By contrast, the same periods have seen EUR’s share grow by 2.1 percentage points, with the currency remaining by far the most dominant currency for non-Eurozone cross-border payments using Swift after USD.
Over the last few years several other currencies have seen their share increase, with GBP outpacing JPY to become the third-most-used currency for such payments, while CNY has seen gains in early 2024 drop to put it behind CAD.
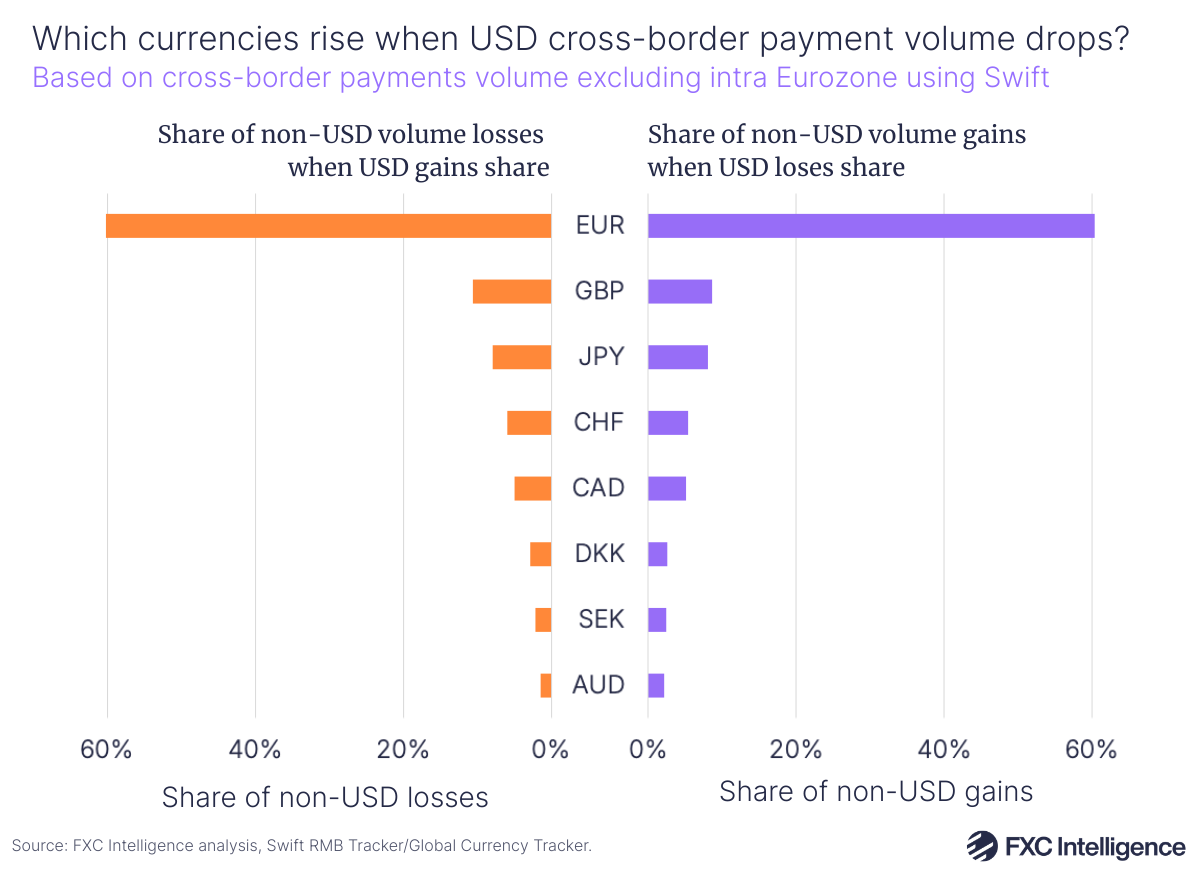
It is also interesting to look at which currencies are favoured when USD loses share in volume, with the currency seeing month-on-month declines in just below half of the months in the period we looked at. In these instances, while most other currencies in Swift’s top 20 saw increases, not all did, and for some this jump was much more pronounced.
In months where USD lost share, EUR saw the most gains, increasing by an average of 0.7 percentage points in these months and accounting for 60% of all such gains. Second were GBP and JPY, which only saw average increases of 0.1 percentage points but accounted for 9% and 8% of total gains respectively.
There were also others that have a lower overall share of cross-border payments volumes but saw outsized gains when USD saw losses. CHF, for example, had the eighth-largest share of volumes in January 2026, but was the fourth largest in terms of volume gains when USD fell, while DKK was the 15th largest in terms of volumes, but the sixth in terms of volumes gained against USD.
By contrast, CNY was notable for being the only currency to notably move in the same direction as USD, seeing its share drop by an average of 0.1 percentage points when USD saw a drop, and growing by the same amount when USD increased.
The trends were also notable in reverse, with similar drops in volume share when USD saw gains across such currencies, although EUR and GBP both saw a higher share of volume losses when USD volume rose than they saw gains when it fell.