We review how international bank transfer fees compare between North America and the Eurozone, using FXC Intelligence data.
Comparing international bank transfer fees can give a clearer view of the different pricing strategies that banks are adopting worldwide. To demonstrate this, we’ve used FXC Intelligence data to break down cross-border pricing for banks in North America and the Eurozone in 2023, with some interesting results.
As a reminder, the total cost of transfers for cross-border payment sends are primarily made up of two items: the flat fee that many banks charge for cross-border transfers and the costs derived from the FX margin, which is the additional rate that banks apply to transfers requiring a currency conversion.
How fees and FX margins influence total transfer cost

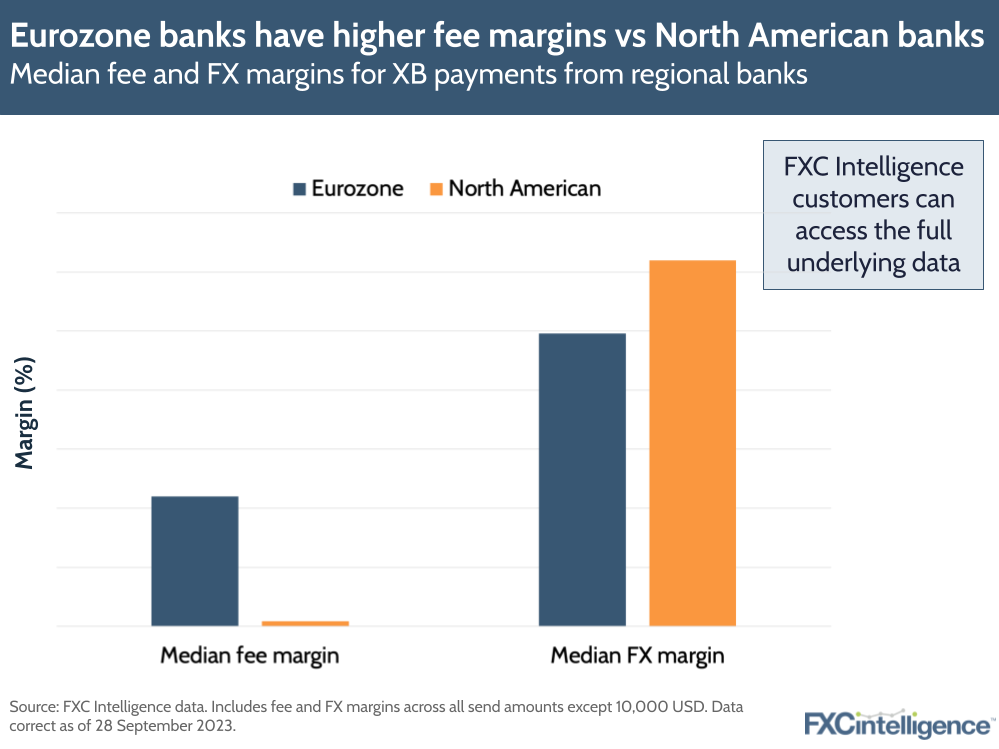
The graphic above shows the median fee margin and the FX margin for cross-border transfers from banks in North America and the Eurozone, spanning all send amounts in our dataset (with the exception of $10,000, removed for clarity reasons). The fee margin is calculated by dividing the fee by the amount sent; for example, for a transfer of $1,000 with a fee of $10, the fee margin would be 10/1,000.
Based on FXC data, North American banks currently have higher FX margins for international bank transfers on average than banks in Eurozone countries. However, banks in the Eurozone have a higher fee margin, and this difference is especially apparent at lower send amounts.
It should be noted that even though send amounts here are displayed in USD, the European banks tracked are in the Eurozone and FX margins may not be applied on money transfers to other banks in countries that are using the euro. Given the significant number of such transfers from banks in these countries, the FX margin figure may therefore be affected.
How bank fees change based on transaction size
Breaking down different send amounts gives a clearer picture of how banks change their approach depending on the size of the transaction.

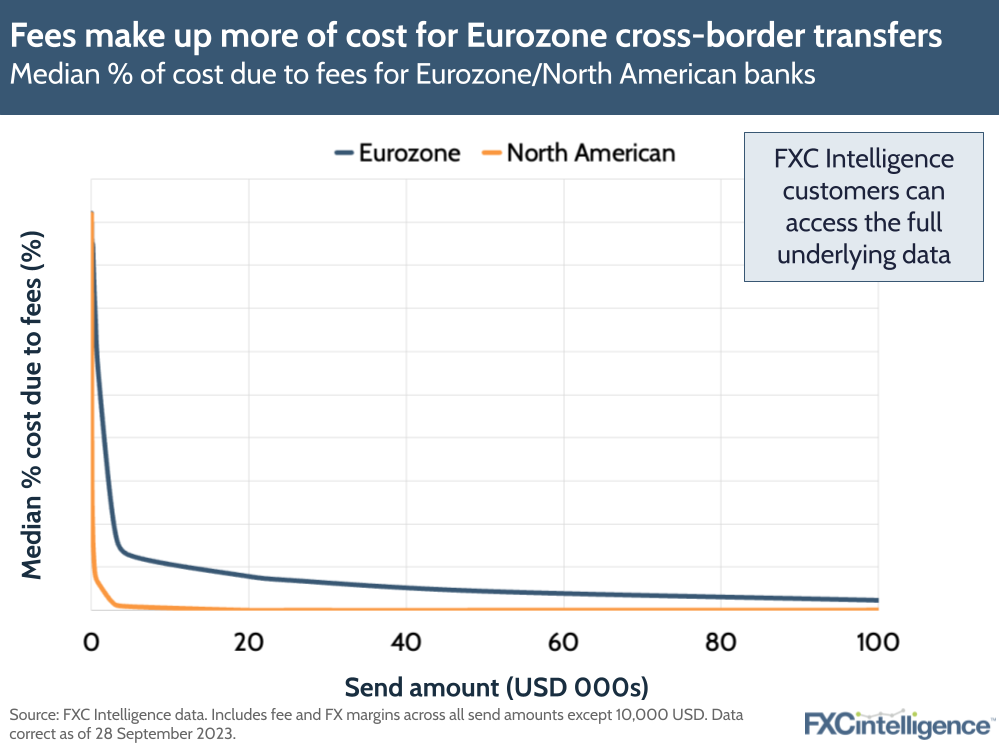
This graphic shows the median percentage of the total cost of cross-border transfers that are due to fees (i.e. not due to FX costs). Note that this is separate from the fee margin, which refers to the fee divided by the amount being sent. Instead, this shows the fee as a percentage of the total cost to the customer making the transfer.
The above chart shows how, across send amounts, a higher percentage of Eurozone bank costs come from fees when compared to North American banks, though this gap starts to close as the send amount increases and the FX margin becomes more and more influential to the total cost for both regions.
When examining how the median fee margin changes as send amounts increase (FXC Intelligence customers can access the full underlying data), we’ve seen that although fees are initially high in proportion to lower send amounts, this drops down to almost 0 as the send amount increases. This shows that for the most part fees remain flat and the cost of sending money in both regions comes primarily from the FX margin.
When taken together, these points show that Eurozone banks have higher fees across the board, but that this difference matters most at low send amounts. Ultimately, costs tends to be higher for European banks at lower send amounts due to higher fees, while the cost is higher for North American banks at higher send amounts due to higher FX margins.


