In its Q3 2026 results, Mastercard continued to see ongoing cross-border volume growth, though headwinds from intra-Europe volumes caused growth to slow compared to previous quarters. Overall, the company saw net revenue rise 14% to $9.8bn, driving an operating margin of 60%, versus 59% in the same period last year.
Chart data
| Quarter | Cross-border volume growth (local currency) | Intra-Europe cross-border volume growth | Other cross-border volume growth |
|---|---|---|---|
| Q1 22 | 50% | 50% | 56% |
| Q2 22 | 58% | 59% | 58% |
| Q3 22 | 44% | 36% | 53% |
| Q4 22 | 31% | 24% | 38% |
| Q1 23 | 35% | 32% | 39% |
| Q2 23 | 24% | 19% | 29% |
| Q3 23 | 21% | 19% | 24% |
| Q4 23 | 18% | 17% | 19% |
| Q1 24 | 18% | 17% | 19% |
| Q2 24 | 17% | 15% | 18% |
| Q3 24 | 17% | 17% | 17% |
| Q4 24 | 20% | 20% | 20% |
| Q1 25 | 15% | 15% | 16% |
| Q2 25 | 15% | 17% | 13% |
| Q3 25 | 15% | 16% | 13% |
| Q4 25 | 14% | 15% | 13% |
| Q1 26 | 13% | 14% | 12% |
| Q2 26 | 12% | 12% | 11% |
| Q3 26 | 11% | 10% | 12% |
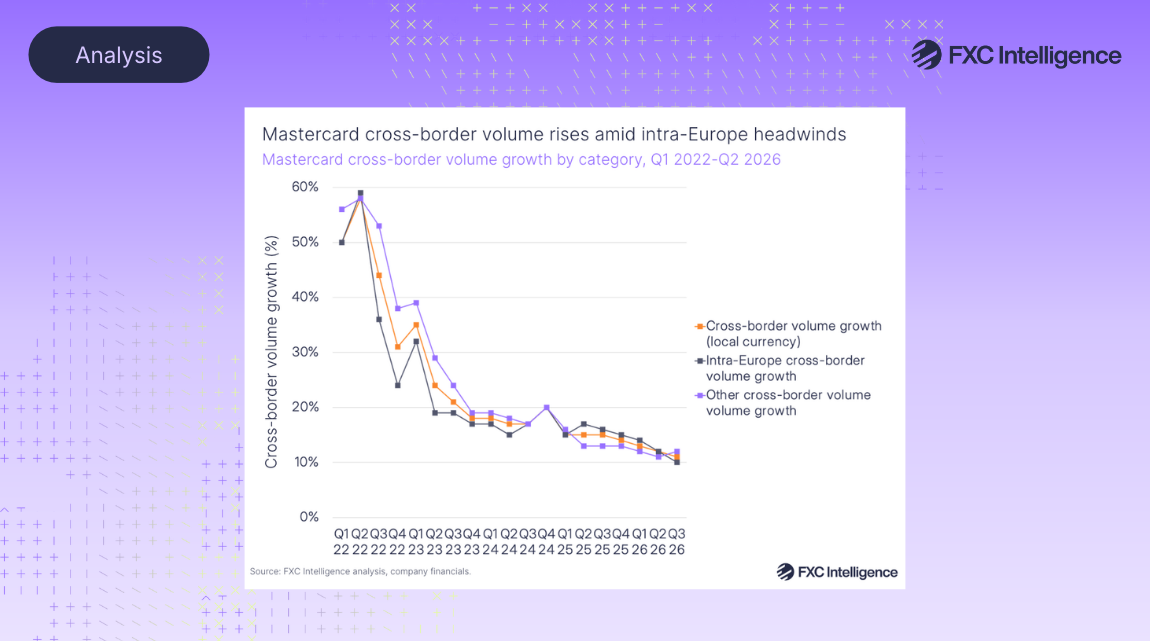
Cross-border volumes rose by 11% in Q3 2026 YoY, representing continued growth but marking a slowdown compared to previous years. Intra-Europe cross-border volume grew by 10% versus 16% the previous year, while other cross-border volume excluding Europe rose by 12%, down from 13% the previous year.
New Mastercard CFO Ling Hai said that overall cross-border volume growth was driven by continued growth in both travel and non-travel-related cross-border spending. However, Mastercard is seeing impacts to intra-Europe volumes as a result of a new customs fee in the EU, the timing of large retail promotional events and lower crypto purchases.
Chart data
| Quarter | Cross-border card not present volumes, excluding travel | Cross-border travel volumes (card present plus card not present travel) |
|---|---|---|
| Q1 23 | 13% | 59% |
| Q2 23 | 16% | 29% |
| Q3 23 | 19% | 23% |
| Q4 23 | 18% | 18% |
| Q1 24 | 21% | 17% |
| Q2 24 | 20% | 15% |
| Q3 24 | 19% | 15% |
| Q4 24 | 21% | 18% |
| Q1 25 | 19% | 12% |
| Q2 25 | 20% | 12% |
| Q3 25 | 21% | 11% |
| Q4 25 | 19% | 11% |
| Q1 26 | 18% | 8% |
| Q2 26 | 20% | 6% |
| Q3 26 | 15% | 8% |
These factors contributed to a QoQ decline in cross-border card-not-present (excluding travel) volume growth for Mastercard, which was 15% versus 20% in Q2 2026 and 21% in Q3 2025. Cross-border travel volume growth rose sequentially to 8%, up from 6% the prior quarter, though this was down from 11% in Q3 2025. Having said this, the company noted continued stability in other cross-border volumes, which it says are ‘higher yielding’ than intra-Europe volumes.
Hai added that the company has seen some negative impacts to travel volumes as a result of the Middle East conflict, but he also gave an example of growing outbound volumes from Venezuela, highlighting how the company’s diversification continues to drive growth amid periods of geopolitical uncertainty.
In a similar vein, Mastercard’s expansion has seen it continue to grow payment volumes outside the US across its credit, charge, debit and prepaid programs, with Worldwide less US transactions accounting for around 80% of all transactions in Q3 2026, versus 79% in Q3 2025, and 68% of payment volumes versus 67% in Q3 2025.
Mastercard sees continued growth of value-added services
Both cross-border and domestic transactions drove overall payment network revenue up by 11%, though Mastercard continues to see faster net revenue growth from value-added services and solutions, which saw revenue rise by 19%.
This is being driven by continued demand across some of Mastercard’s other services (e.g. security solutions) and pricing, though the company saw a “minimal impact" from acquisitions and dispositions, including stablecoin infrastructure provider BVNK, which Mastercard completed its acquisition of in August 2026.
Chart data
| Quarter | Payment network revenue | Value-added services and solutions revenue |
|---|---|---|
| Q1 23 | $3.65bn | $2.10bn |
| Q2 23 | $4.07bn | $2.20bn |
| Q3 23 | $4.21bn | $2.32bn |
| Q4 23 | $3.89bn | $2.66bn |
| Q1 24 | $3.92bn | $2.43bn |
| Q2 24 | $4.38bn | $2.59bn |
| Q3 24 | $4.63bn | $2.74bn |
| Q4 24 | $4.41bn | $3.08bn |
| Q1 25 | $4.43bn | $2.82bn |
| Q2 25 | $4.95bn | $3.19bn |
| Q3 25 | $5.18bn | $3.42bn |
| Q4 25 | $4.92bn | $3.89bn |
| Q1 26 | $4.95bn | $3.45bn |
| Q2 26 | $5.45bn | $3.83bn |
| Q3 26 | $5.75bn | $4.06bn |
| Q3 2026 YoY growth | 11% | 19% |
The fees accrued from cross-border transactions also grew at a slower rate in Q3 2026 compared to the previous year, but continue to grow faster than some other assessment lines. Cross-border assessments are the fees that Mastercard charges acquirer banks on card transactions where the merchant country and issuing country are different, whereas domestic assessments refer to the same charges but where the merchant and card issuing country are the same.
Cross-border assessments rose by 16% to $3.8bn, outpacing growth for domestic assessments, which rose by 14% to $3.2bn, as well as transaction processing assessments, which rose 14% to $4.8bn. It also outpaced the 11% YoY growth for cross-border volume, with Hai saying that the gap was driven primarily by pricing in international markets and mix.
Chart data
| Quarter | Domestic assessments | Cross-border assessments |
|---|---|---|
| Q1 23 | $2.25bn | $1.85bn |
| Q2 23 | $2.47bn | $2.05bn |
| Q3 23 | $2.46bn | $2.31bn |
| Q4 23 | $2.38bn | $2.20bn |
| Q1 24 | $2.47bn | $2.24bn |
| Q2 24 | $2.60bn | $2.43bn |
| Q3 24 | $2.64bn | $2.80bn |
| Q4 24 | $2.54bn | $2.71bn |
| Q1 25 | $2.66bn | $2.60bn |
| Q2 25 | $2.79bn | $2.85bn |
| Q3 25 | $2.81bn | $3.31bn |
| Q4 25 | $2.77bn | $3.27bn |
| Q1 26 | $2.90bn | $3.19bn |
| Q2 26 | $3.15bn | $3.46bn |
| Q3 26 | $3.21bn | $3.84bn |
Mastercard ramps up stablecoins and agentic AI transactions
Mastercard gave an update on its integration of BVNK, through which CEO Michael Miebach said the company was “expanding the infrastructure that connects stablecoins with traditional payment and money movement experiences”.
Earlier in October, the company launched Global Money Platform, which allows financial institutions and fintechs to bring accounts to their customers facilitating holding, converting, sending and receiving fiat currencies and stablecoins. Mastercard Move, Mastercard’s B2B2X money movement solution, is integrated with this new platform and enables payouts across 17 billion endpoints.
Mastercard also discussed how it is responding to the use of AI agents in payments, where the company sees the potential to grow transactions and also sees, eventually, a new addressable market emerging for microtransactions. Mastercard has continued to build out an array of products and services to support this space, including Agent Connect, its new solution aiming to bring together merchants, AI agents, digital platforms and payment providers in a single integration.
Mastercard has partnered with Shopify, which has implemented Mastercard’s Agent Pay solution in its Shop Pay checkout solution, using Mastercard’s network tokens to make agentic payments more secure. Separately, the company has signed a partnership with ChatGPT owner OpenAI to collaborate across “payments, joint services growth and AI transformation”.
Miebach says that agentic commerce – where a buyer uses AI agents to discover, select and purchase a product or service – is still in “early days” and numbers are not yet significant, but agentic transactions continue to ramp up. This reflects a similar sentiment seen elsewhere in the industry.
Chart data
| Year | Revenue | Operating margin |
|---|---|---|
| 2016 | $10.8bn | 53.5% |
| 2017 | $12.5bn | 53.0% |
| 2018 | $15.0bn | 48.7% |
| 2019 | $16.9bn | 57.2% |
| 2020 | $15.3bn | 52.8% |
| 2021 | $18.9bn | 53.4% |
| 2022 | $22.2bn | 55.2% |
| 2023 | $25.1bn | 55.8% |
| 2024 | $28.2bn | 55.3% |
| 2025 | $32.8bn | 57.6% |
| 2026E (estimate) | $37.2bn | 59.5% |
For the full year of 2026, Mastercard is expecting net revenue growth to remain at the high end of low double digits, on a currency neutral basis excluding inorganic activity, though the company is anticipating a minimal impact from acquisitions and dispositions and a one percentage point tailwind from FX. For Q4 2026, the company expects to see growth at the high end of low double digits, with about a one percentage point FX headwind.